Dissecting Cleavage Mechanisms
in Tensed Collagen Fibrils
using Reactive Molecular Dynamics Simulations
An orange a day keeps the scurvy away
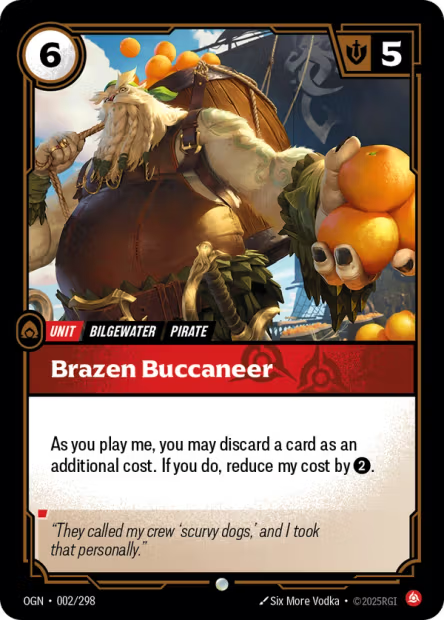
Citrus fruits contain Vitamin C ( 🟠 )
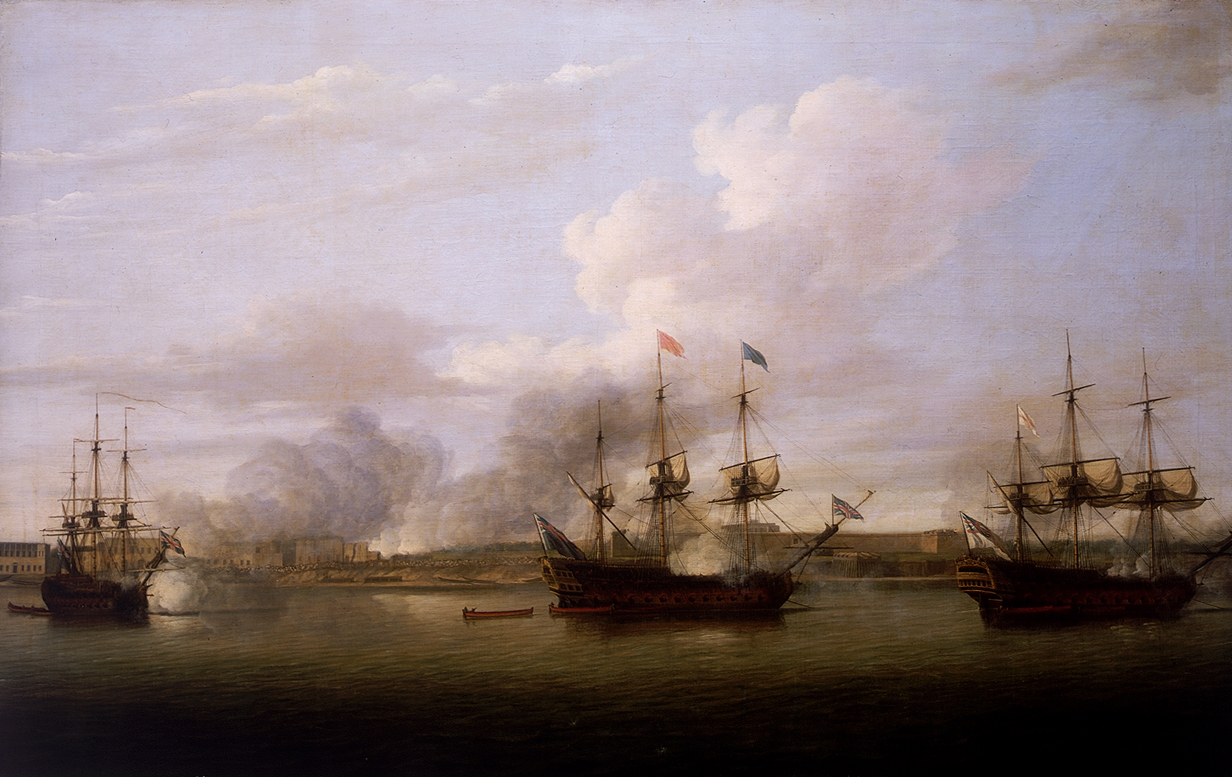
1747, HMS Salisbury, James Lind performs the first clinical trial with a control group [1]
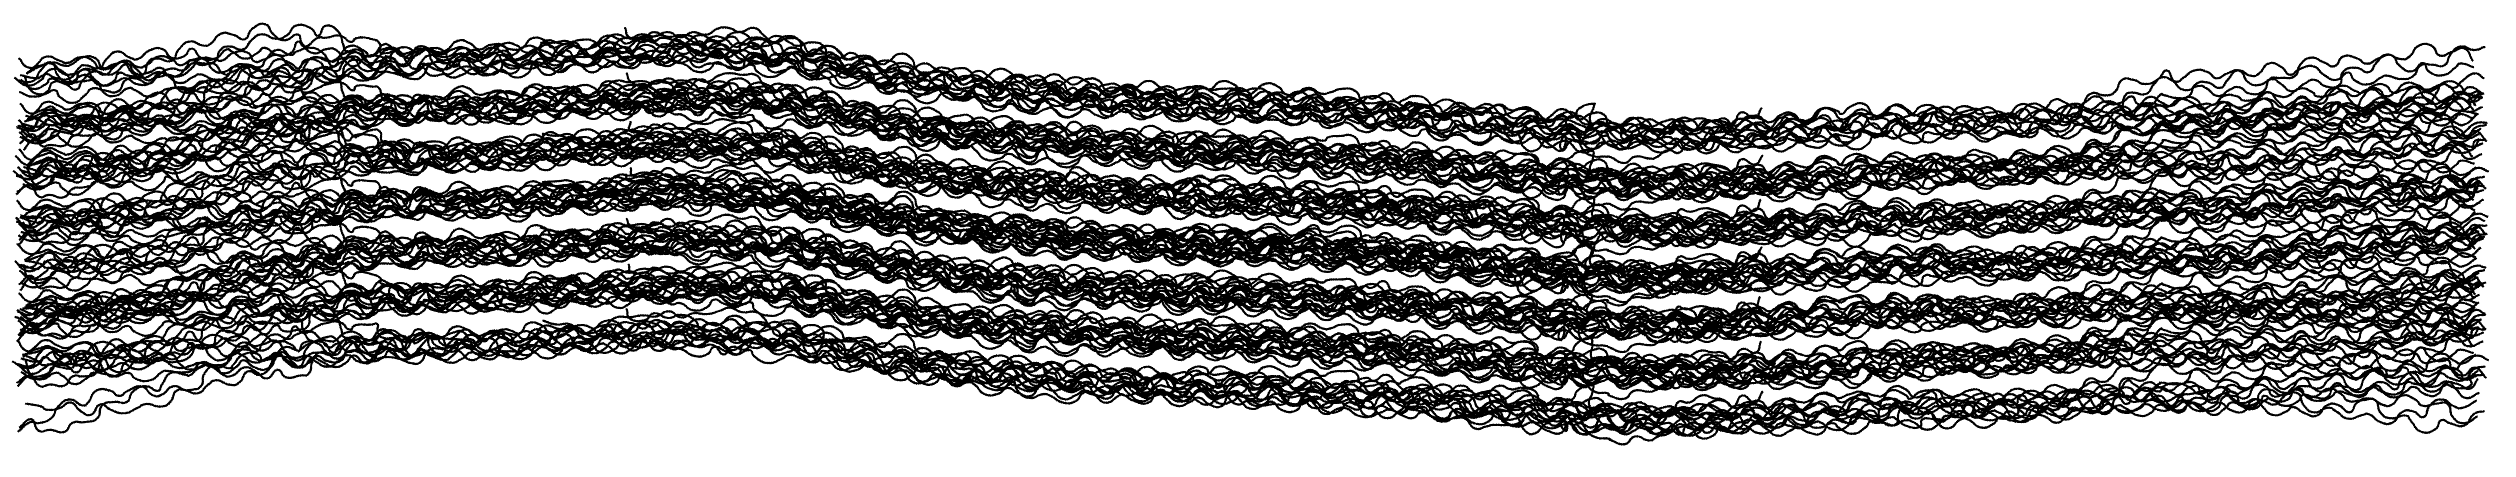
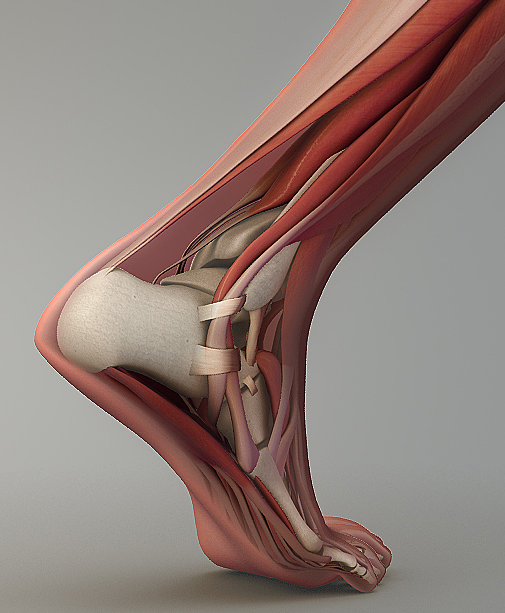
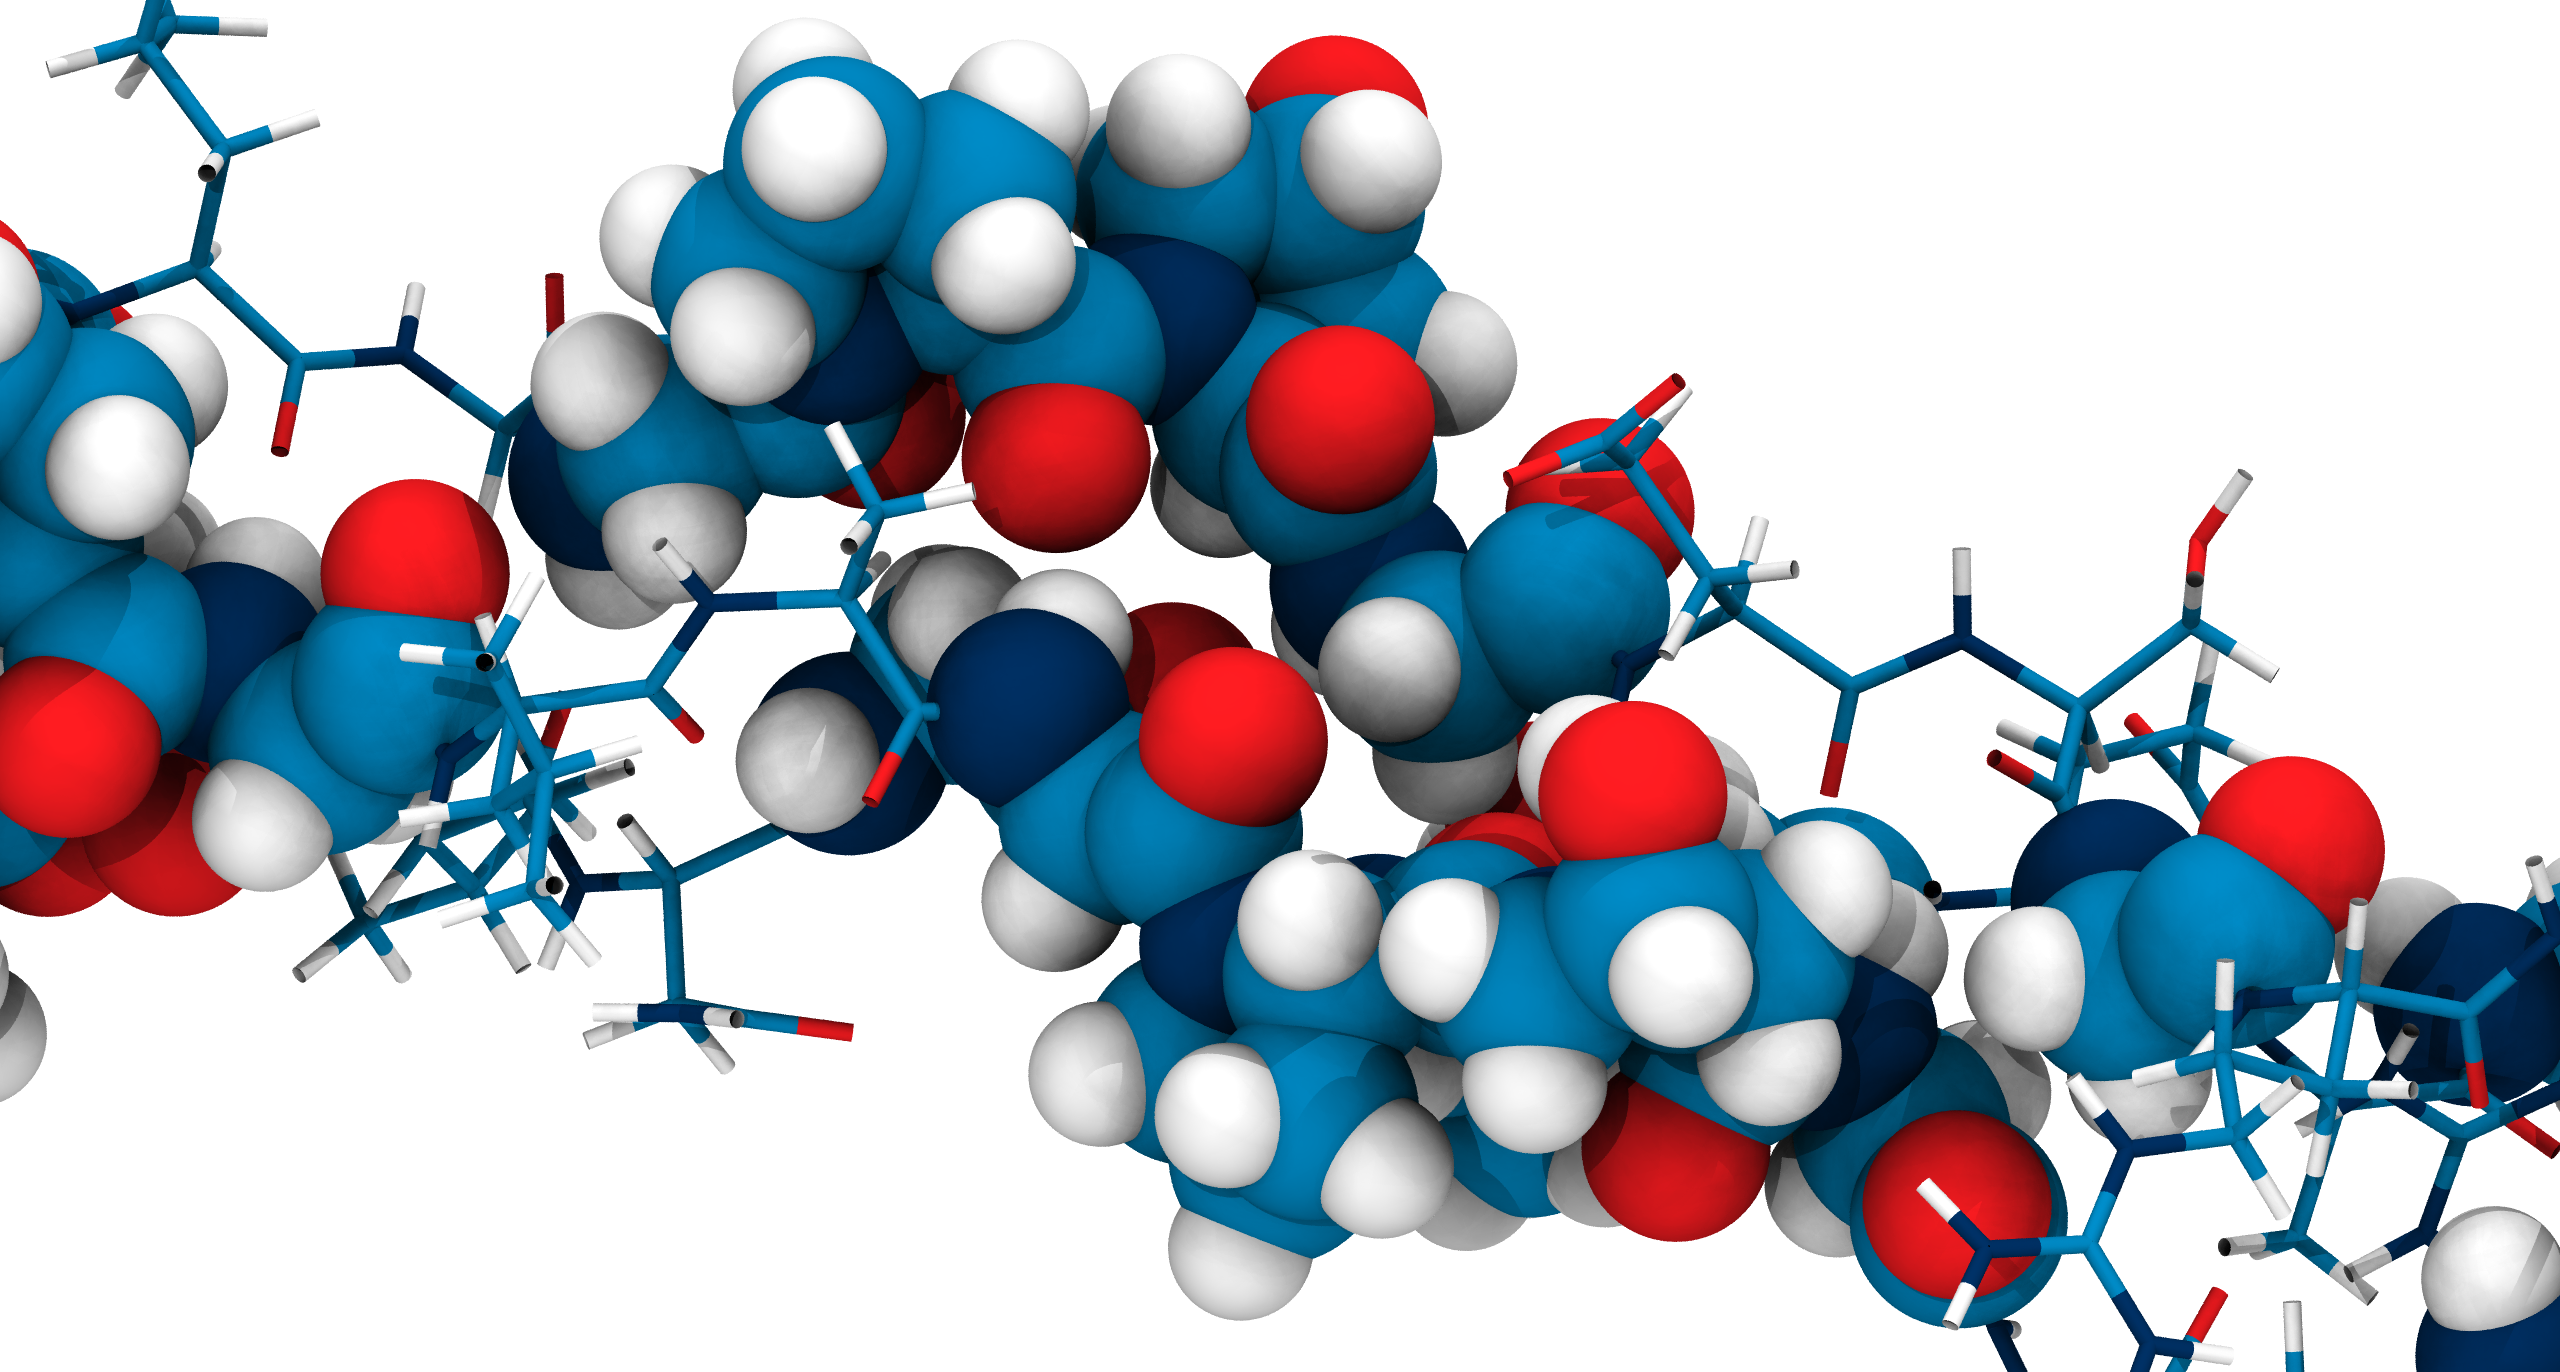
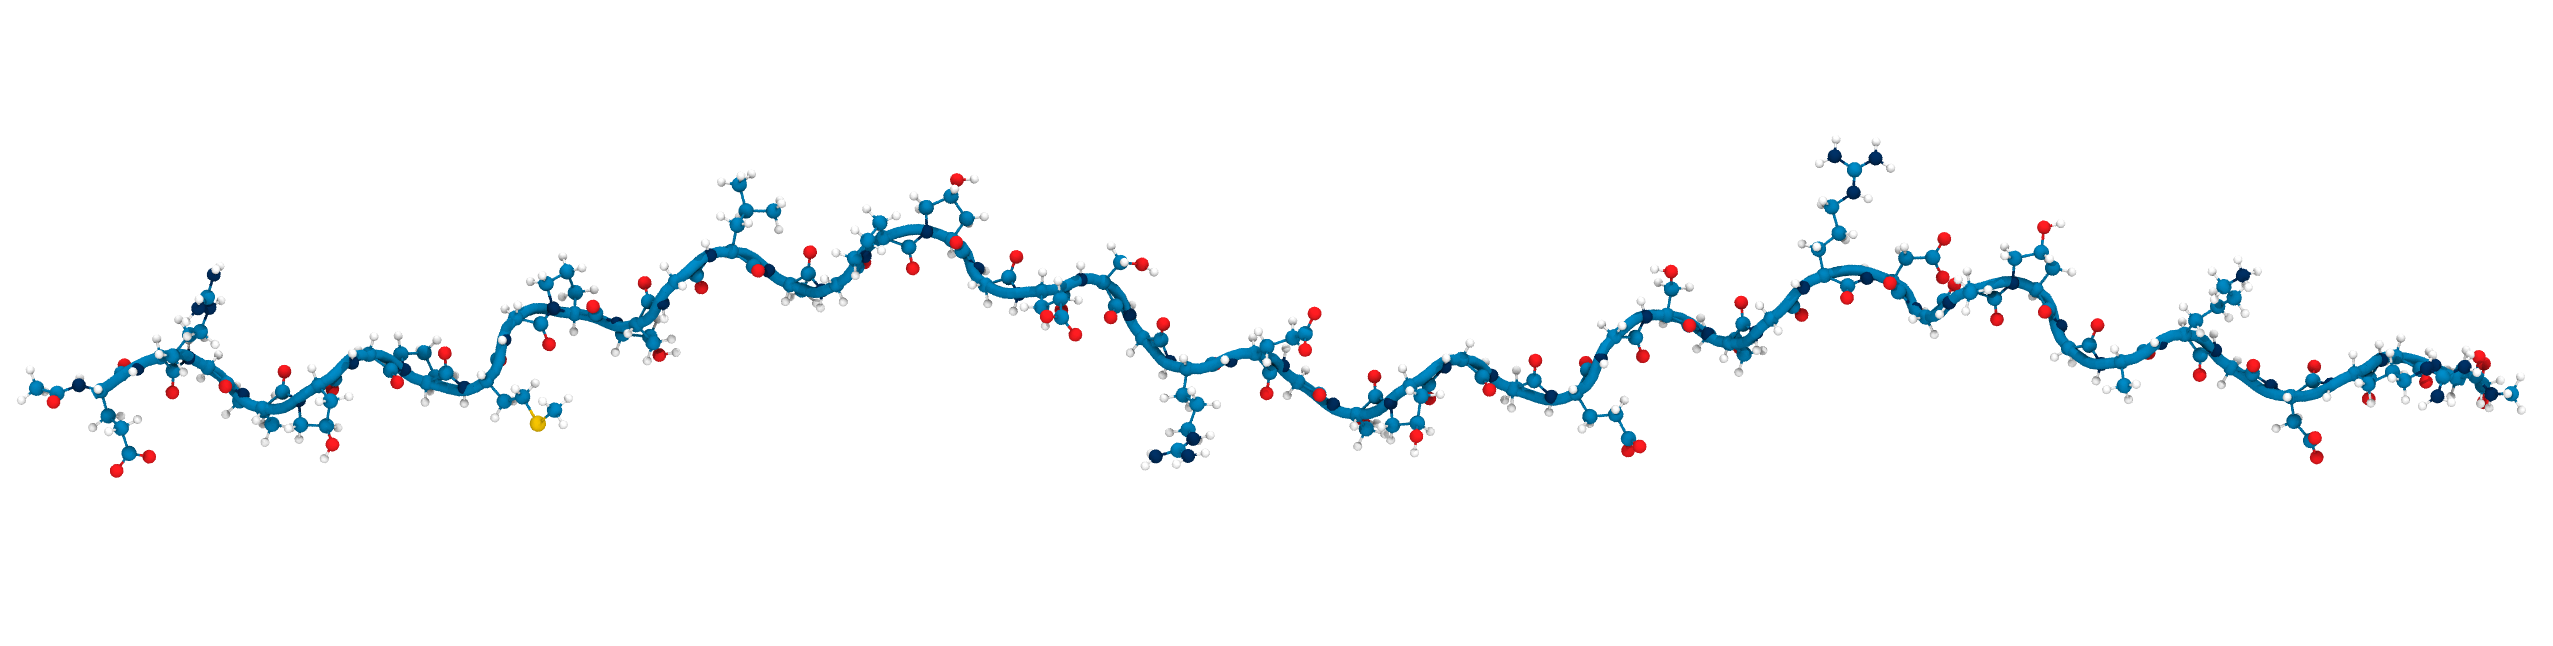
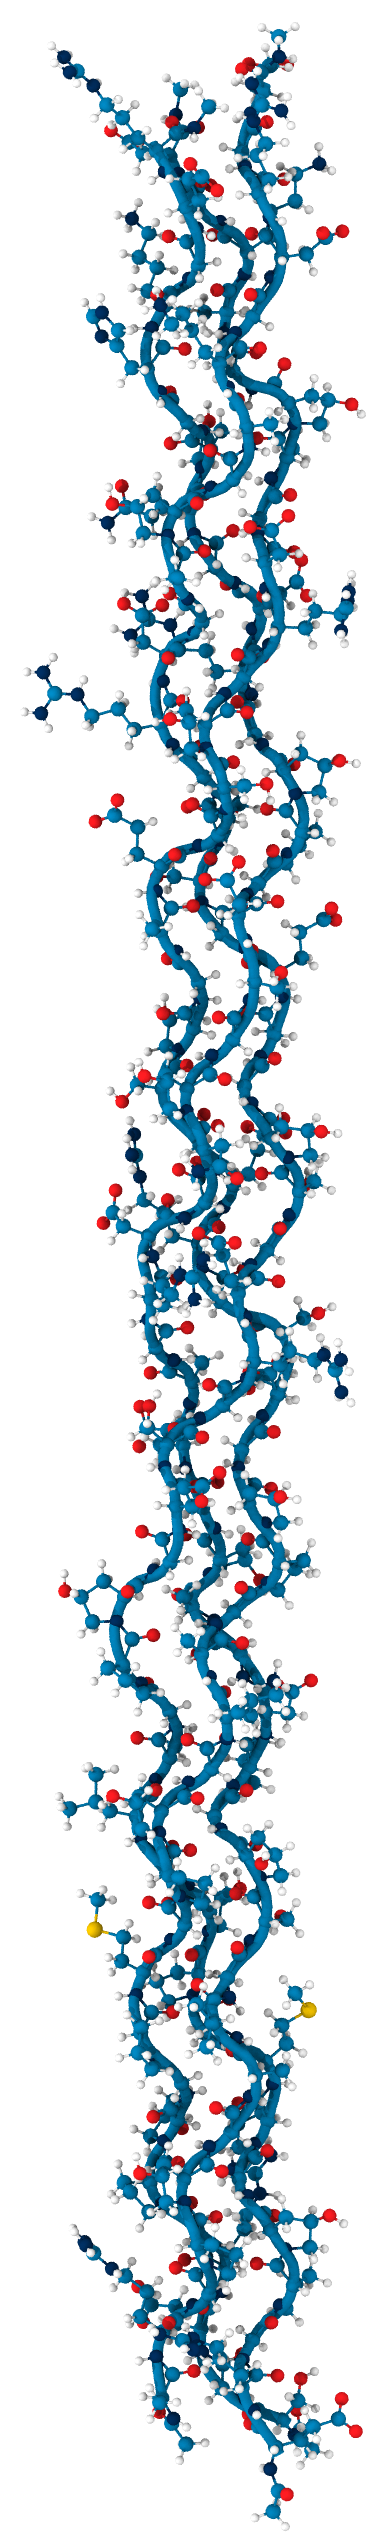
Collagen keeps us together
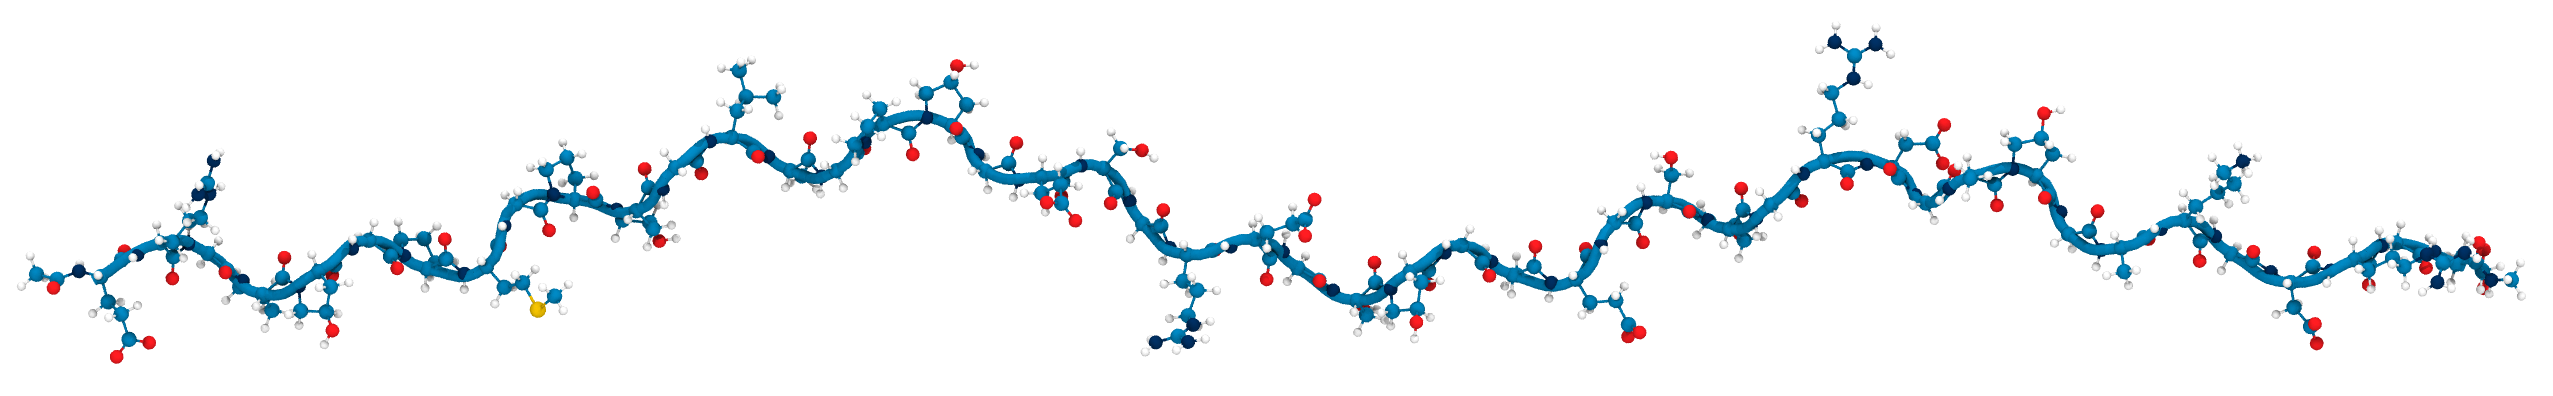

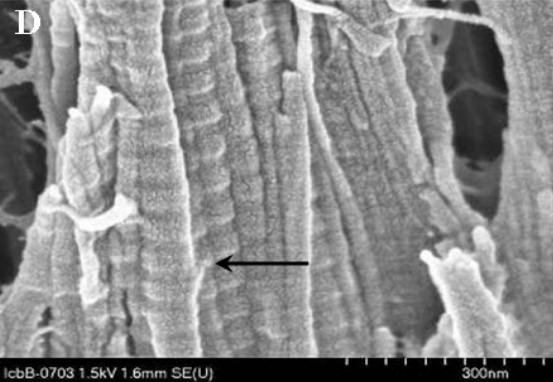
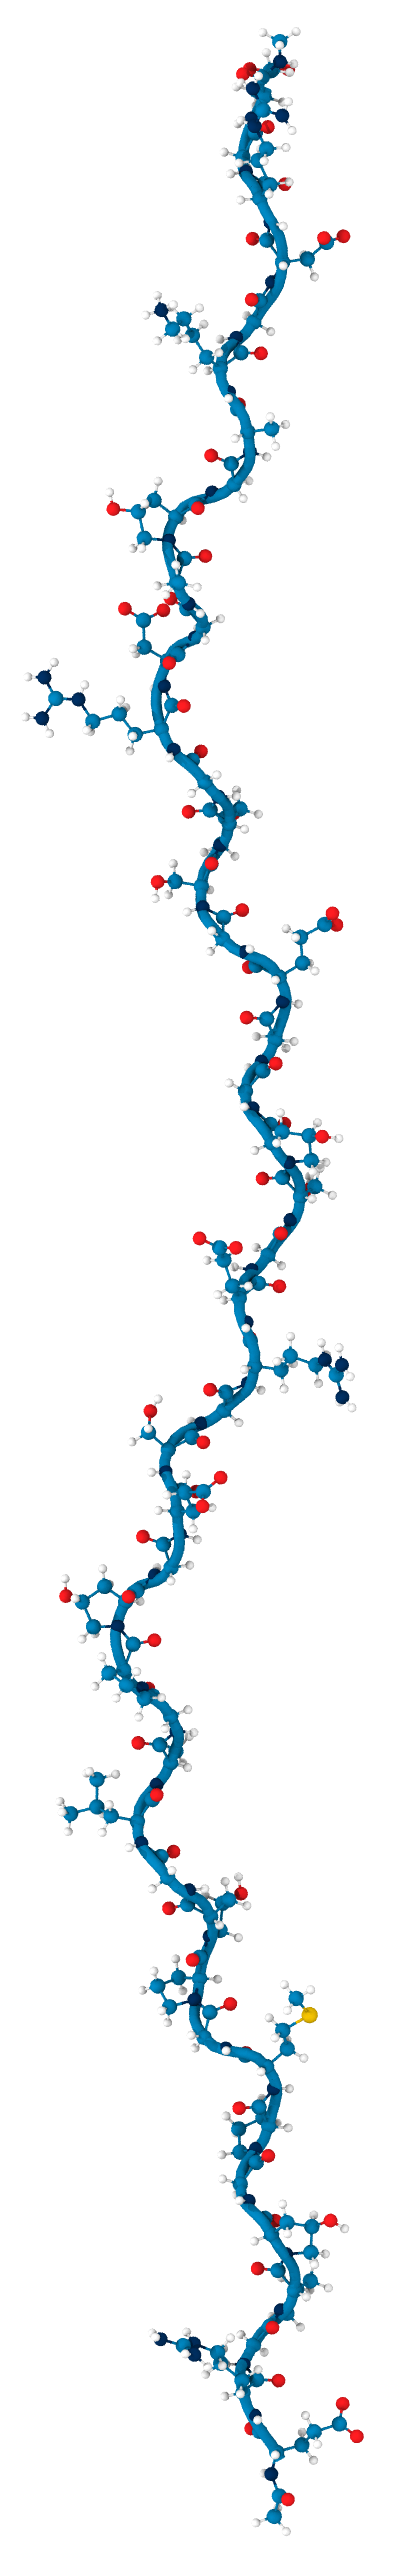
- single peptide
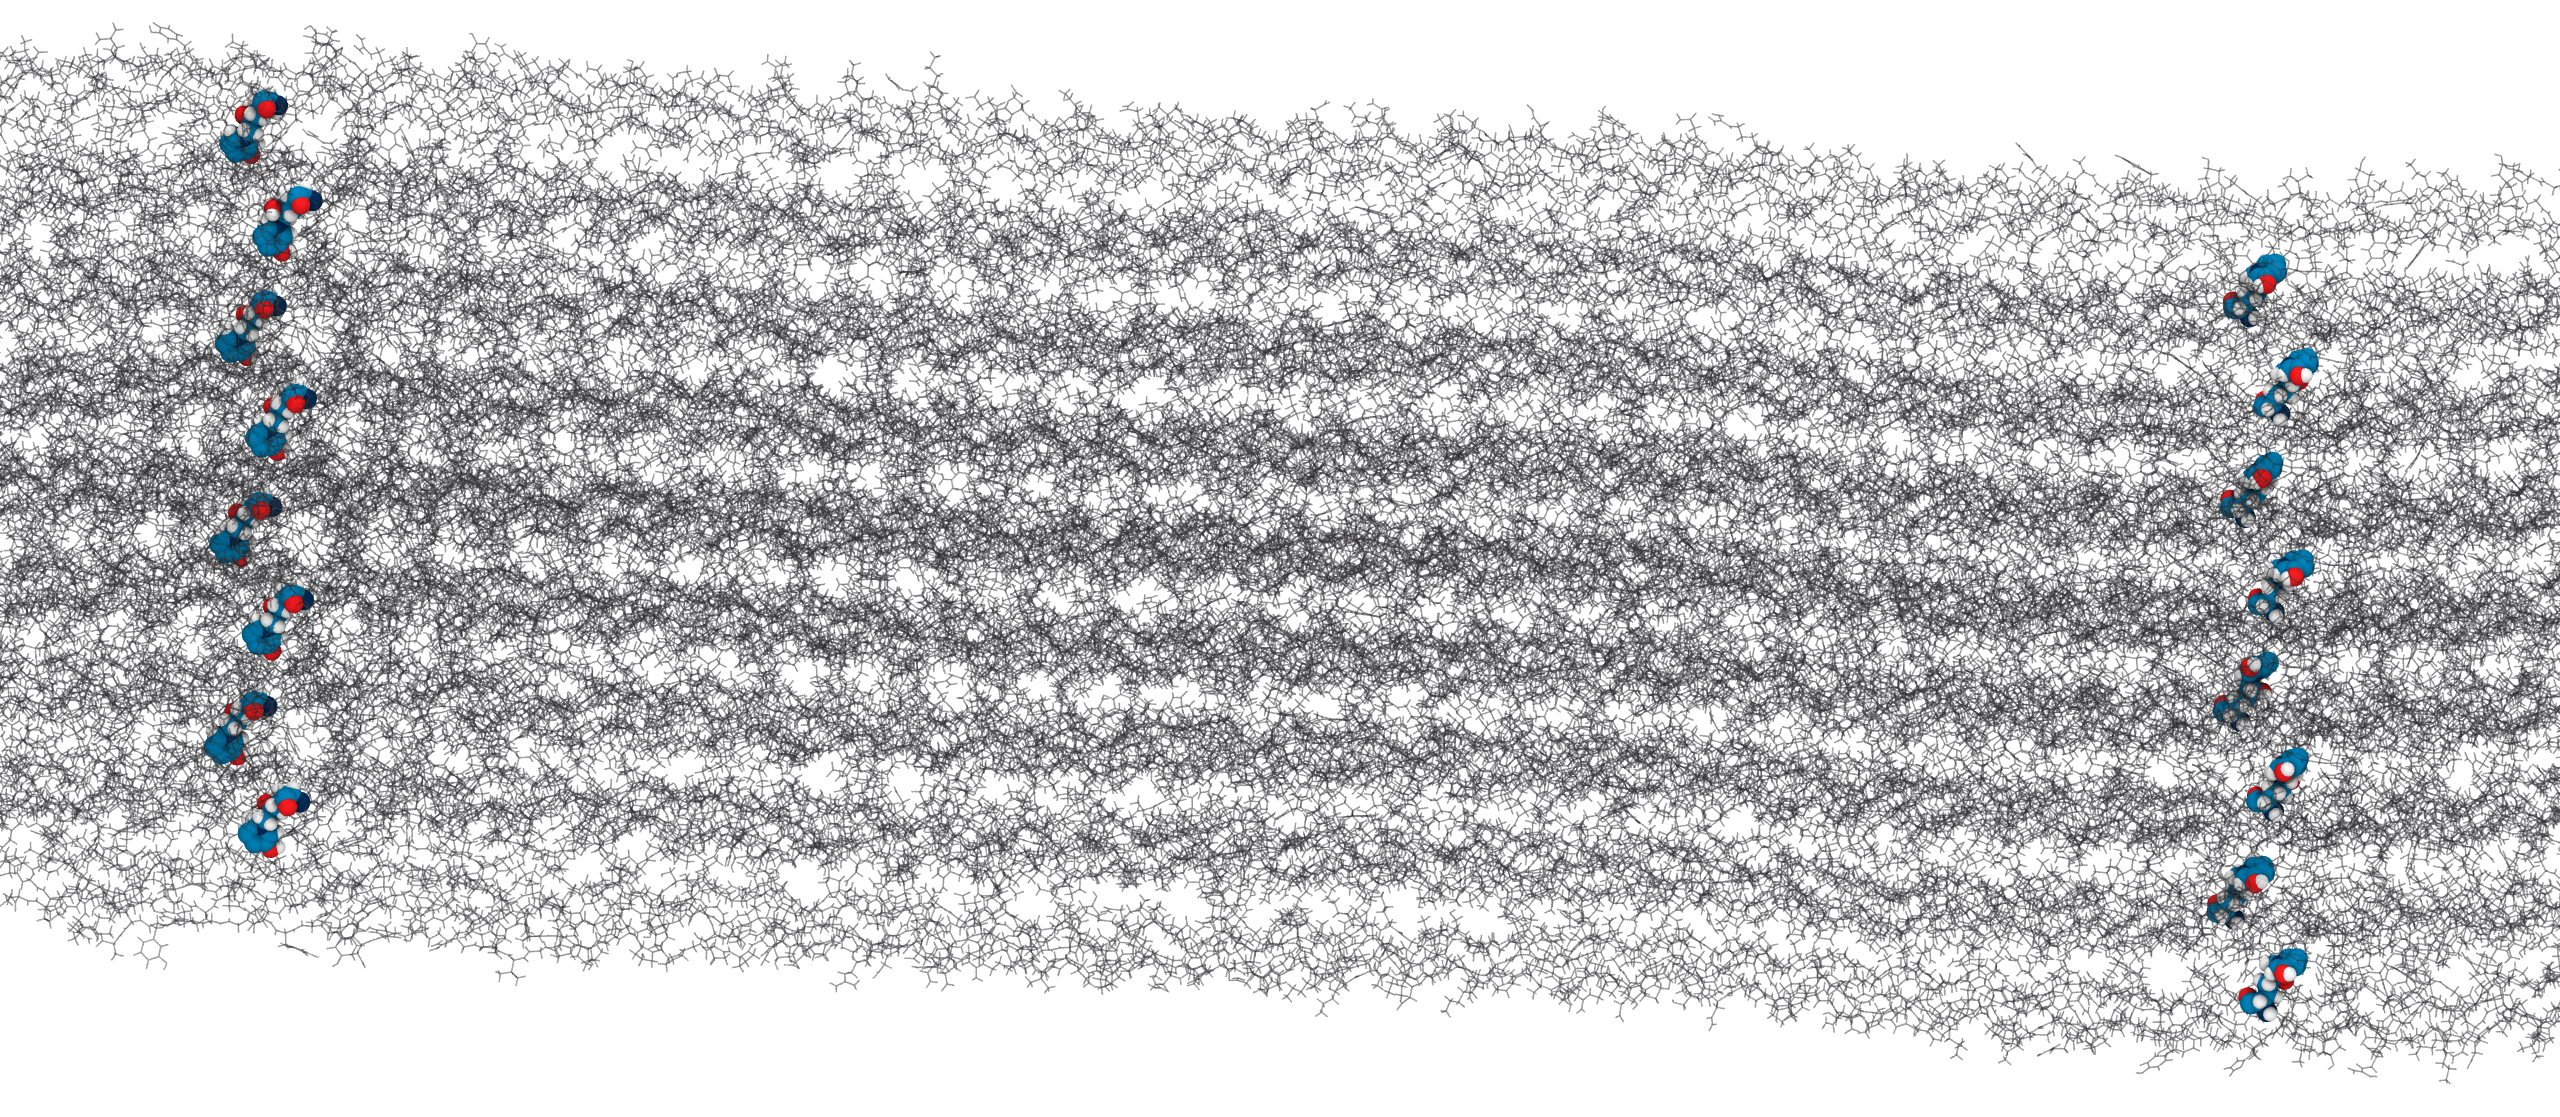
- triple helix
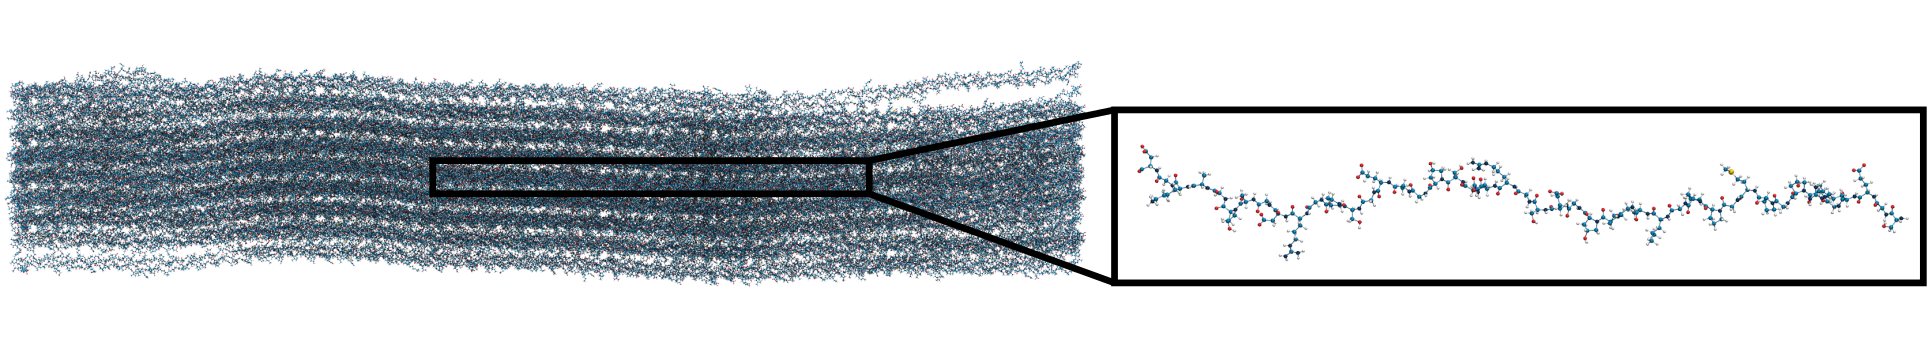
- collagen fibril
The Gly-X-Y motif allows tight turns and packing


X,Y: proline or hydroxyproline
Prolyl hydroxylase ( 🟠 )
Collagen I is cross-linked

Lysyl hydroxylase
→
( 🟠 )

Lysyl oxidase
→

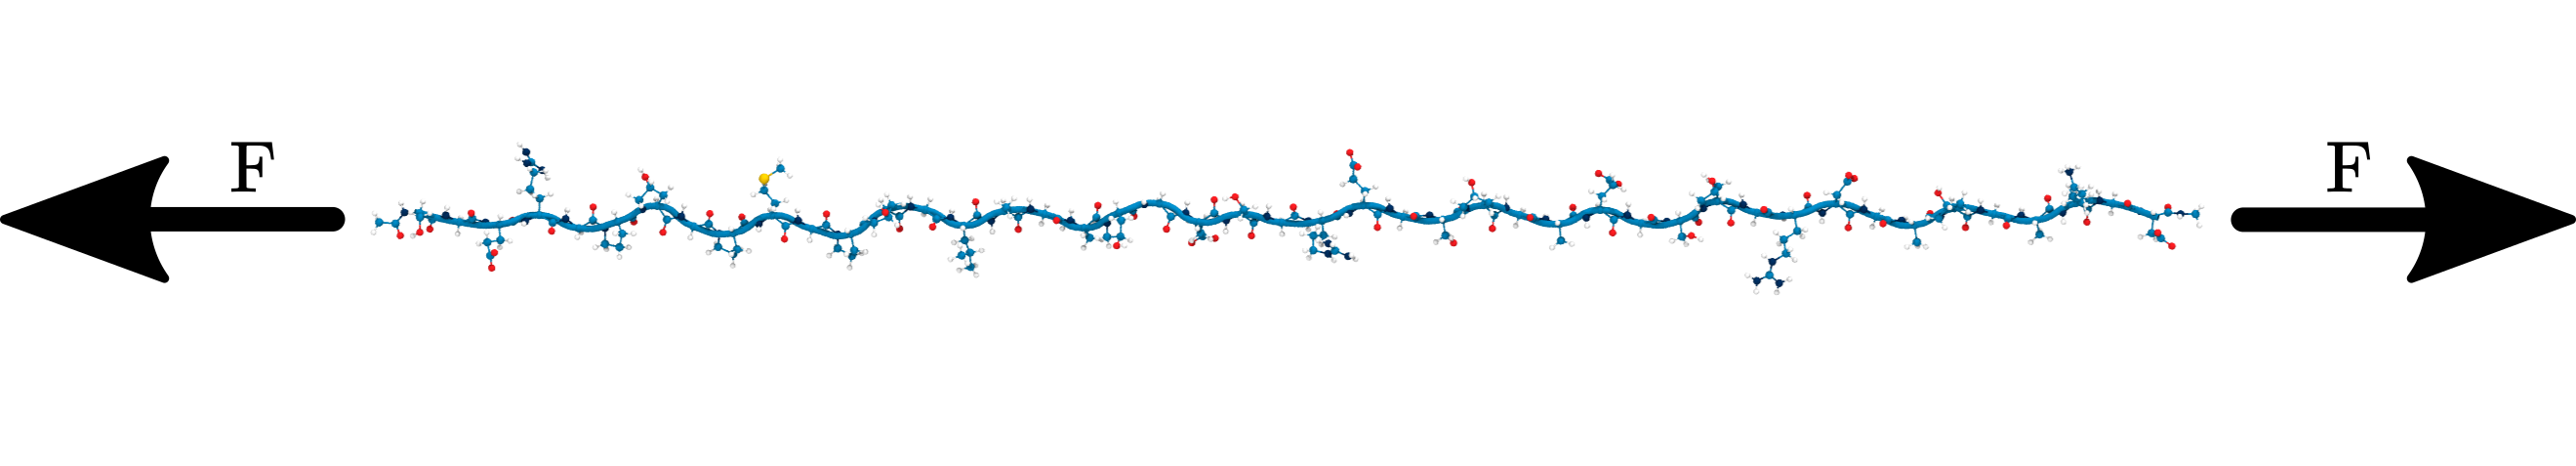
A rather radical discovery: mechanoradicals in collagen

“Mechanoradicals in tensed tendon collagen as a source of oxidative stress”, Zapp et al. (2020) [3]
Dissecting cleavage mechanisms in tensed collagen fibrils using
reactive molecular dynamics simulations

“Mechanical Activation Drastically Accelerates Amide Bond Hydrolysis,
Matching Enzyme Activity”, Pill et al. (2019) [4]
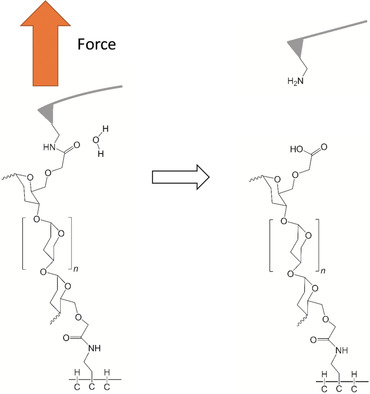
Hydrolysis
vs.
Homolysis
What is the influence of the collagen structure on their competition?
Why do we still see radicals?
Two complementary approaches
QM/MM simulations of
base-catalyzed hydrolysis
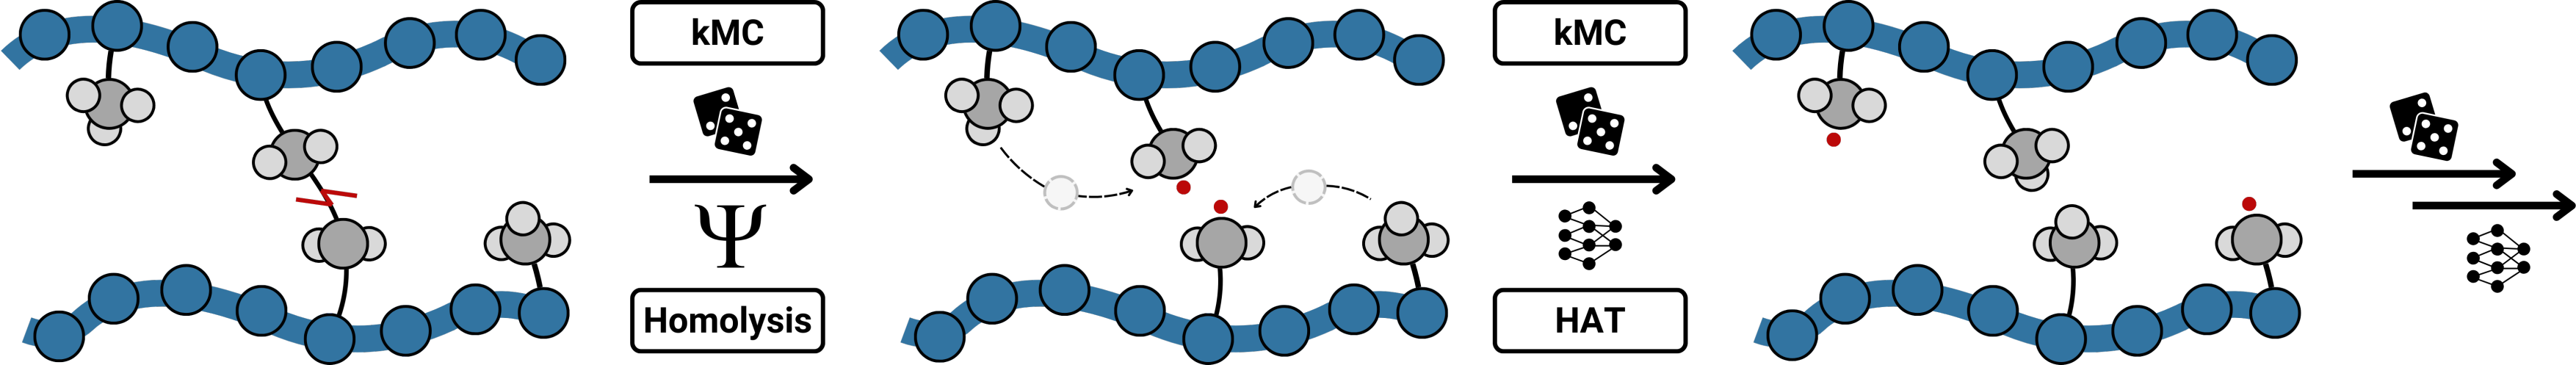
Kinetic Monte Carlo Molecular Dynamics:
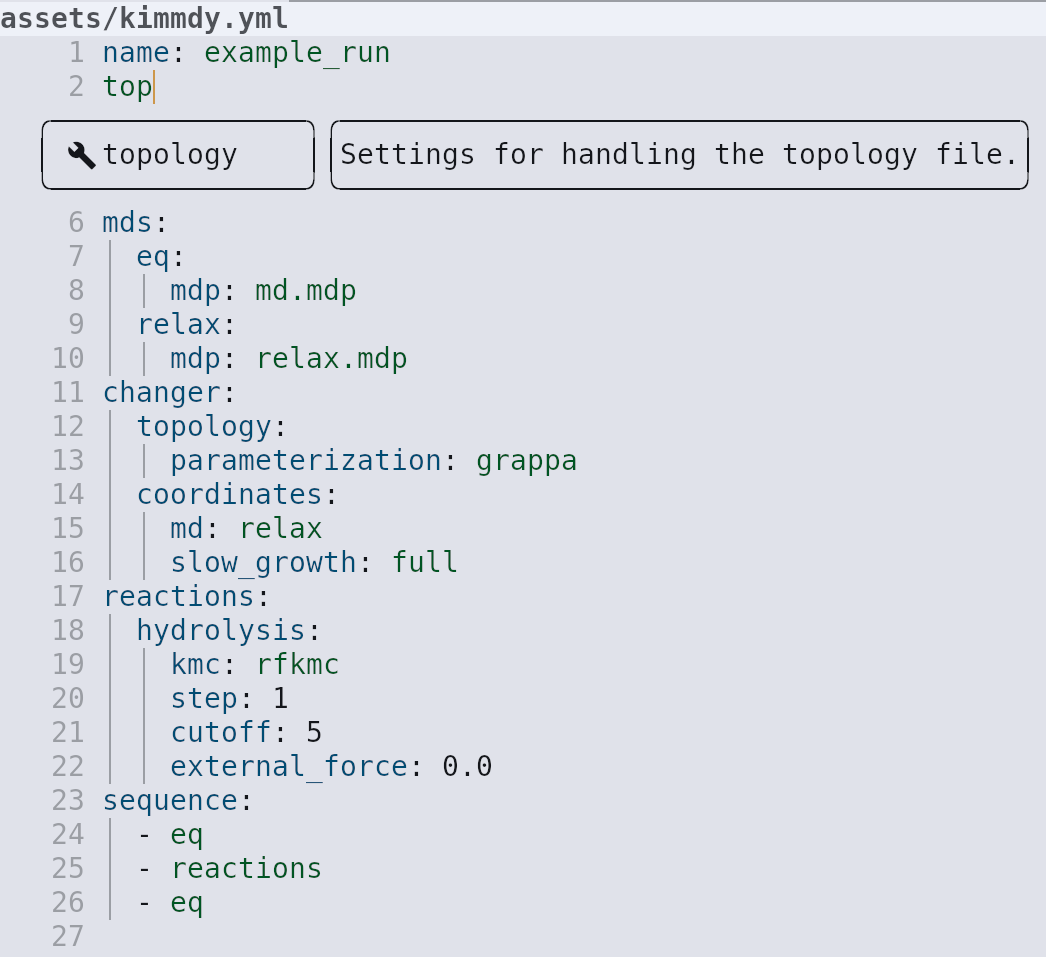
KIMMDY
Molecular dynamics / Molecular Mechanics
How do we make the atoms move?
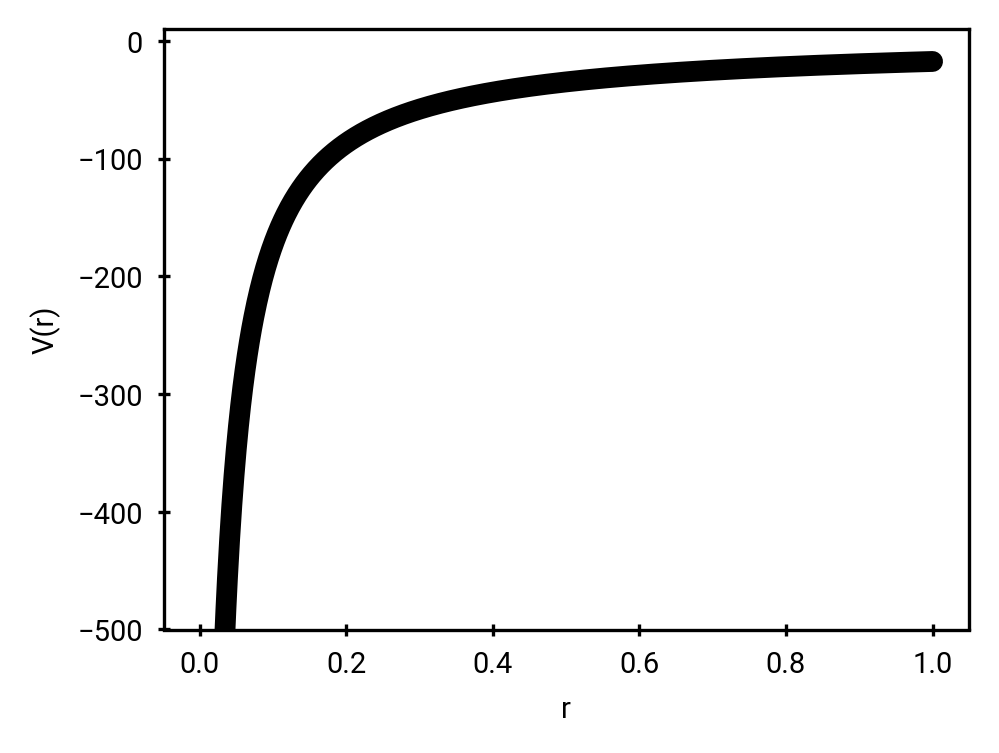
\[ \begin{array}{rcl} F &=& ma \\ -\frac{dV}{dr} &=& m\frac{d^2r}{dt^2}, \end{array} \tag{1}\]
\(V\): potential
\(r\): position
\(F\): force
\(a\): acceleration
\(t\): time
\(m\): mass
Force Fields and Topologies
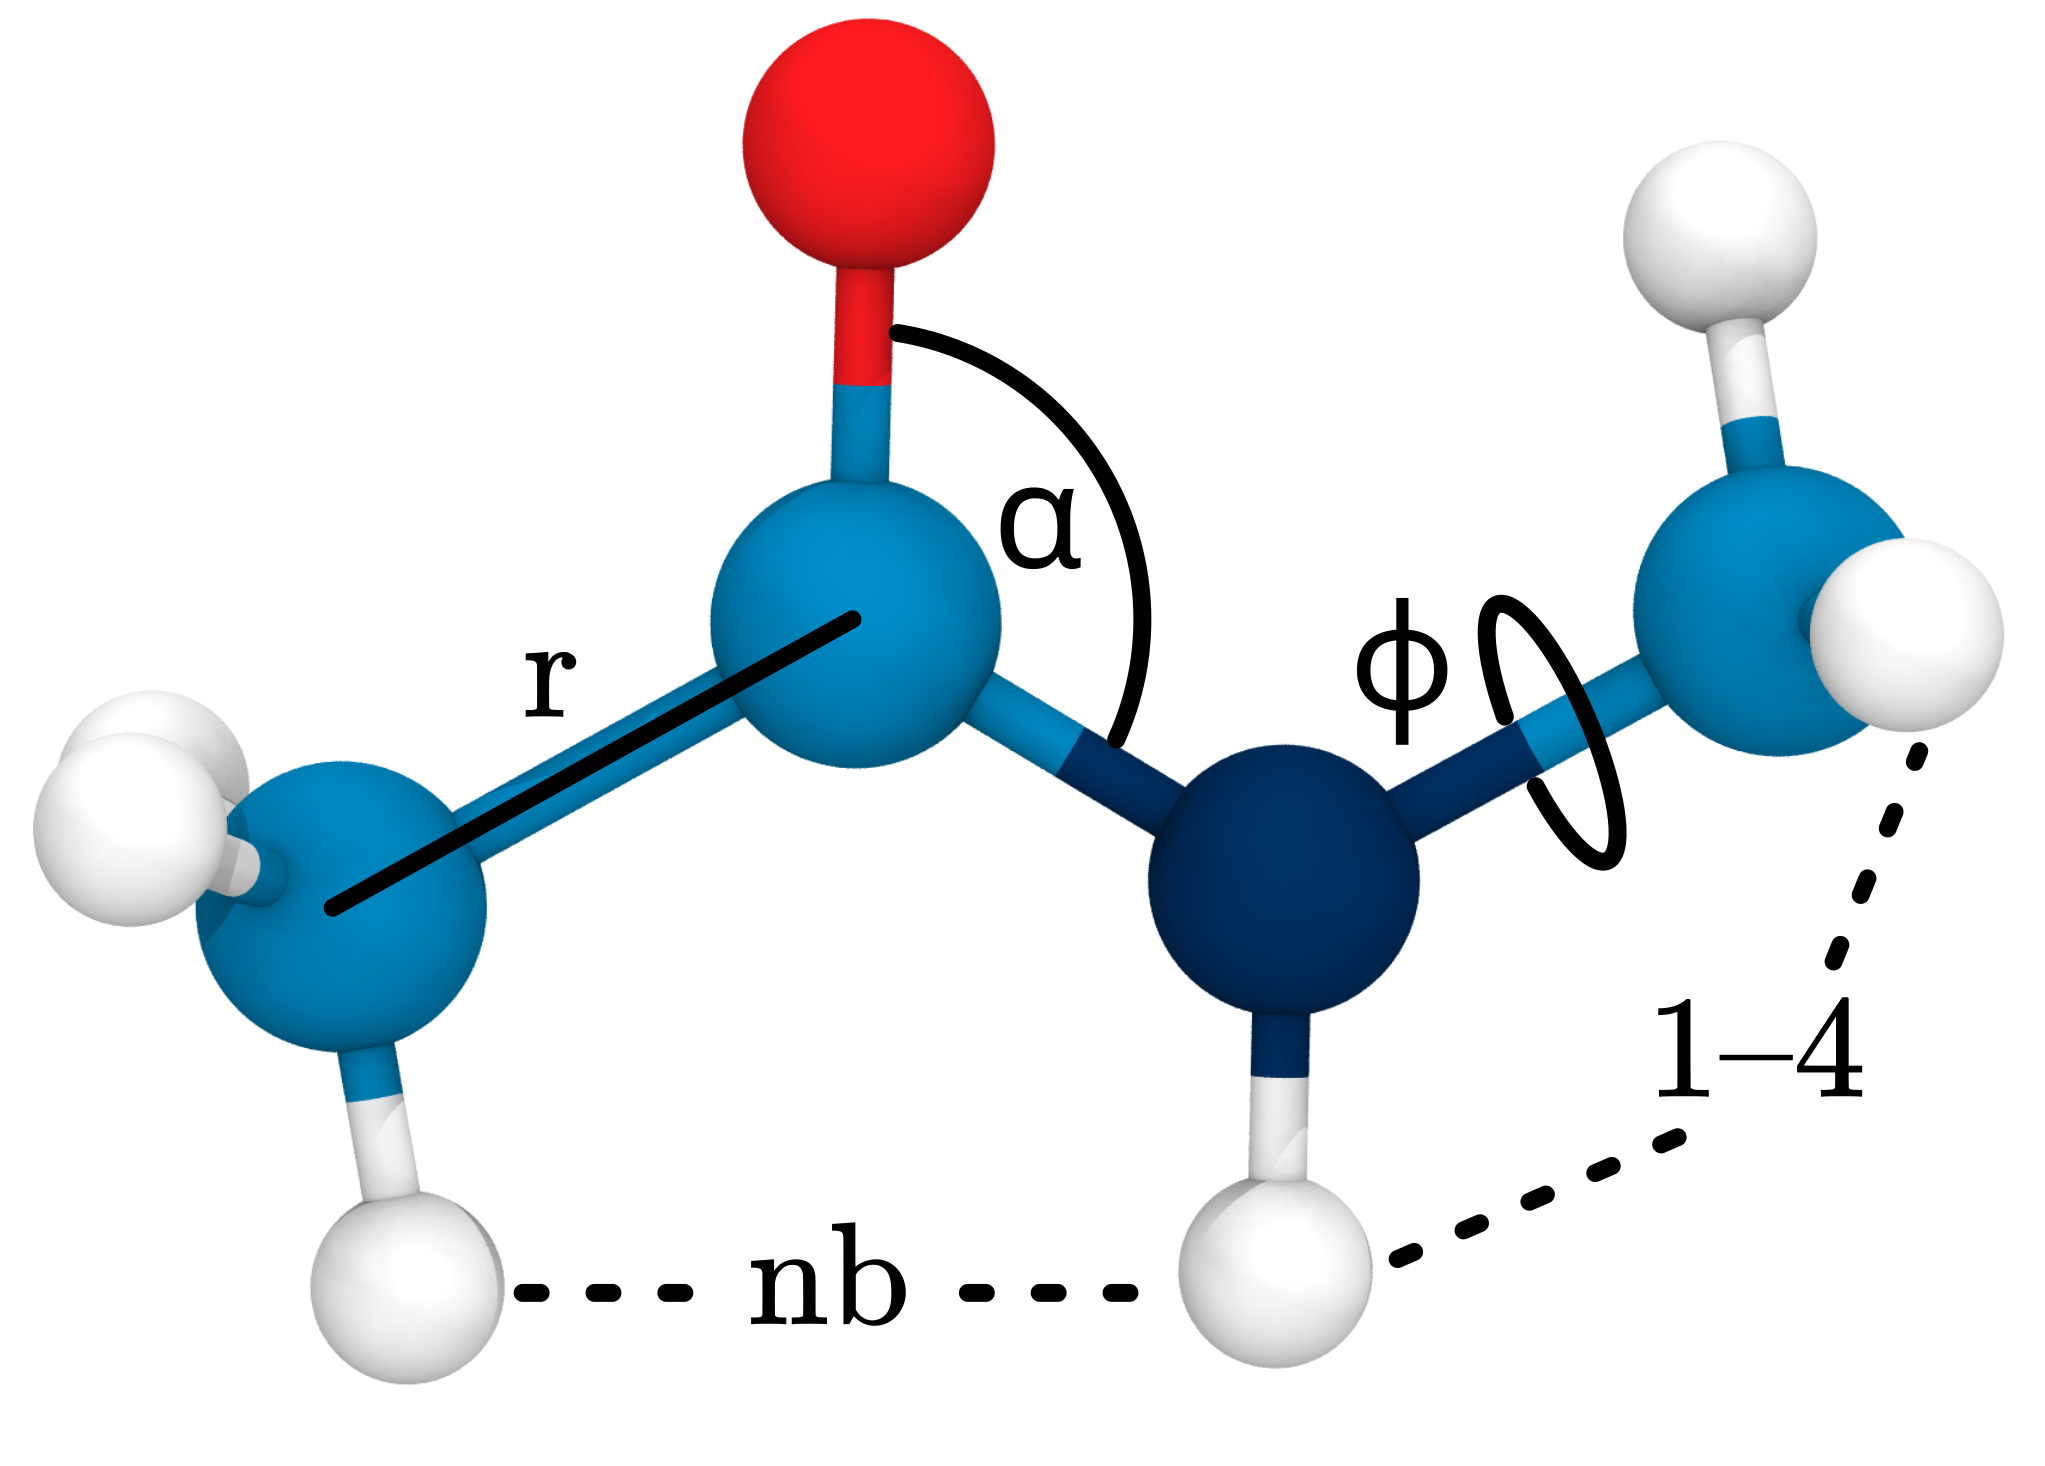
Connectivity and parameters pre-defined!
So how do we do chemistry?
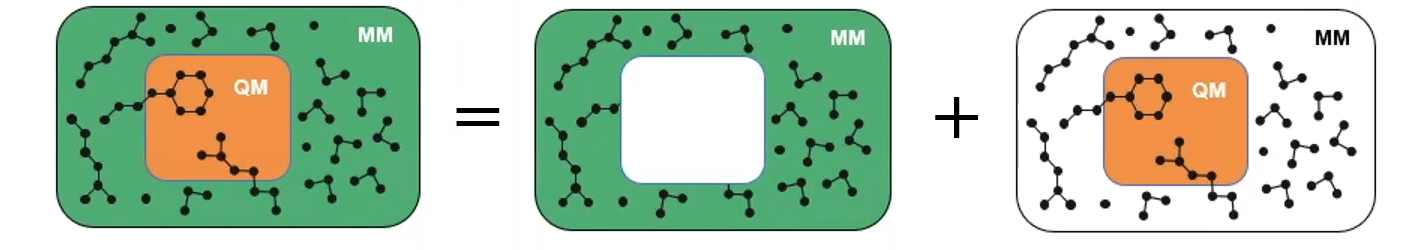
Quantum mechanics/molecular mechanics
DFT: Density Functional Theory
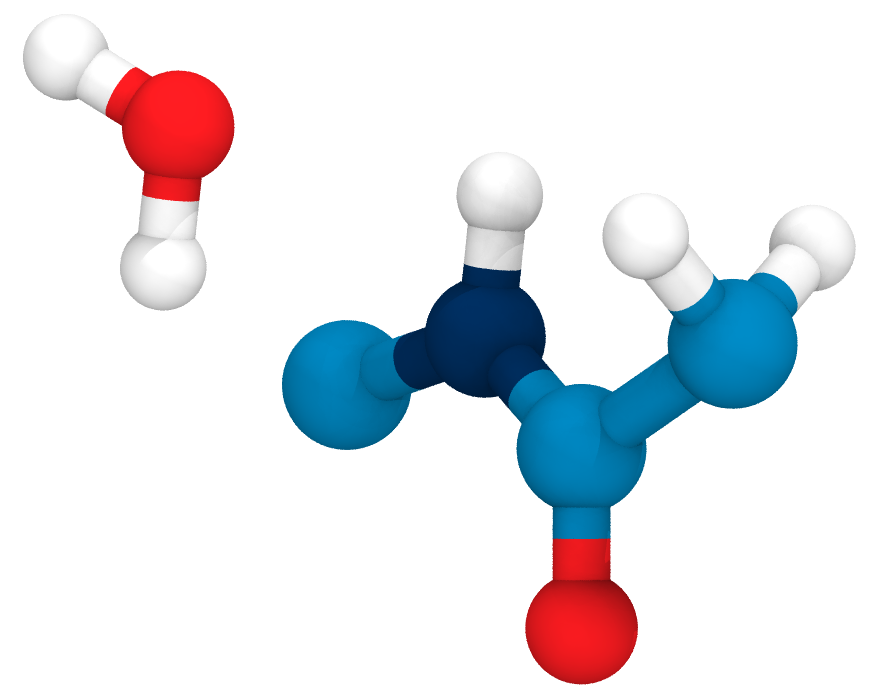
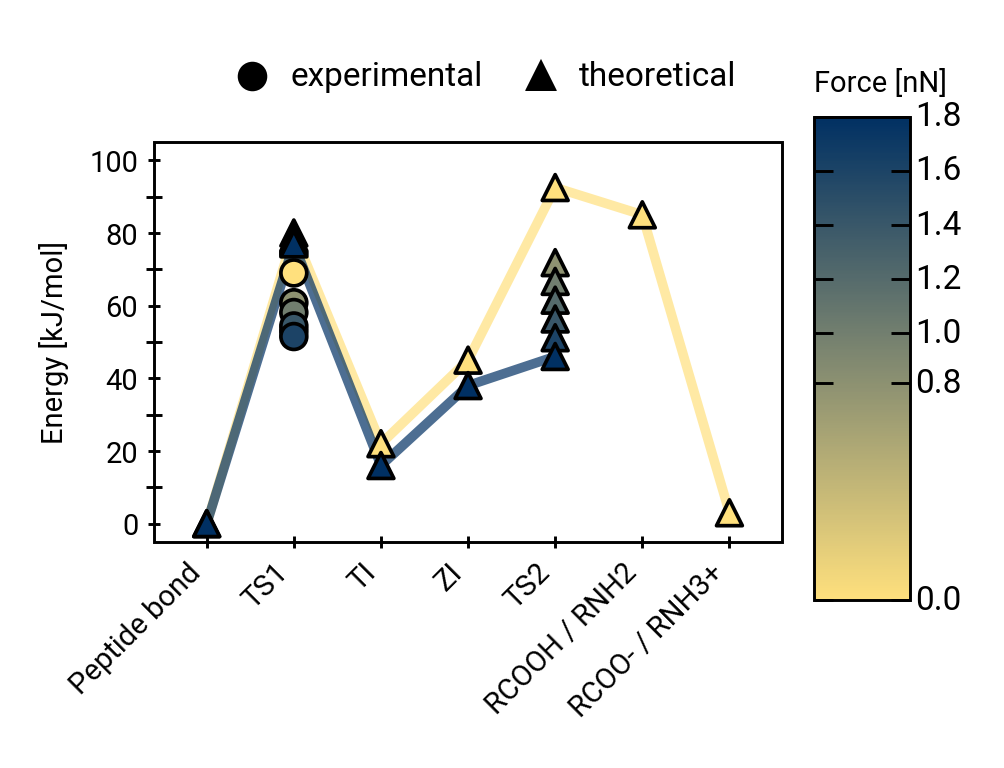
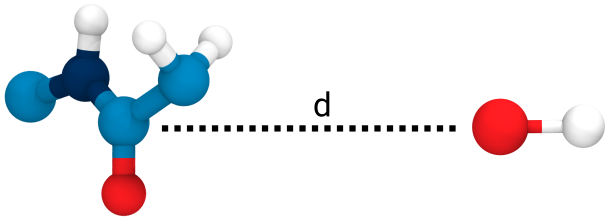
Base-catalyzed hydrolysis

TS: transition state
TI: Tetrahedral Intermediate
ZI: Zwitterionic Intermediate
Previous work on base-catalyzed hydrolysis
System Setup
[]: input parameters.QM region selection and setup
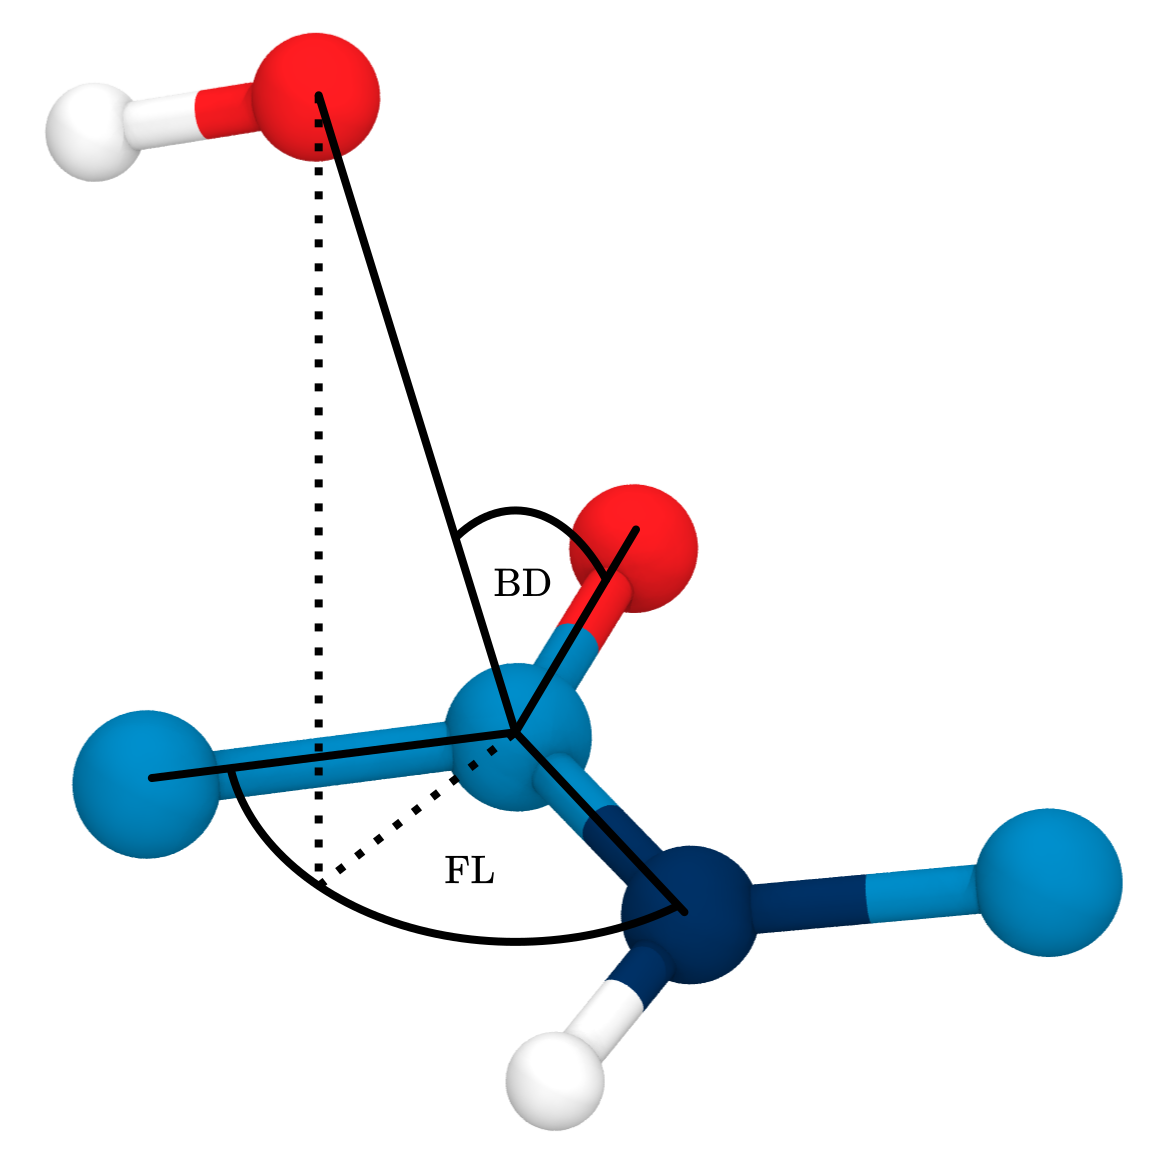
\(BD\): Bürgi-Dunitz angle, 107°
\(FL\): Flippin-Lodge angle, 0°
Umbrella sampling the reaction coordinate
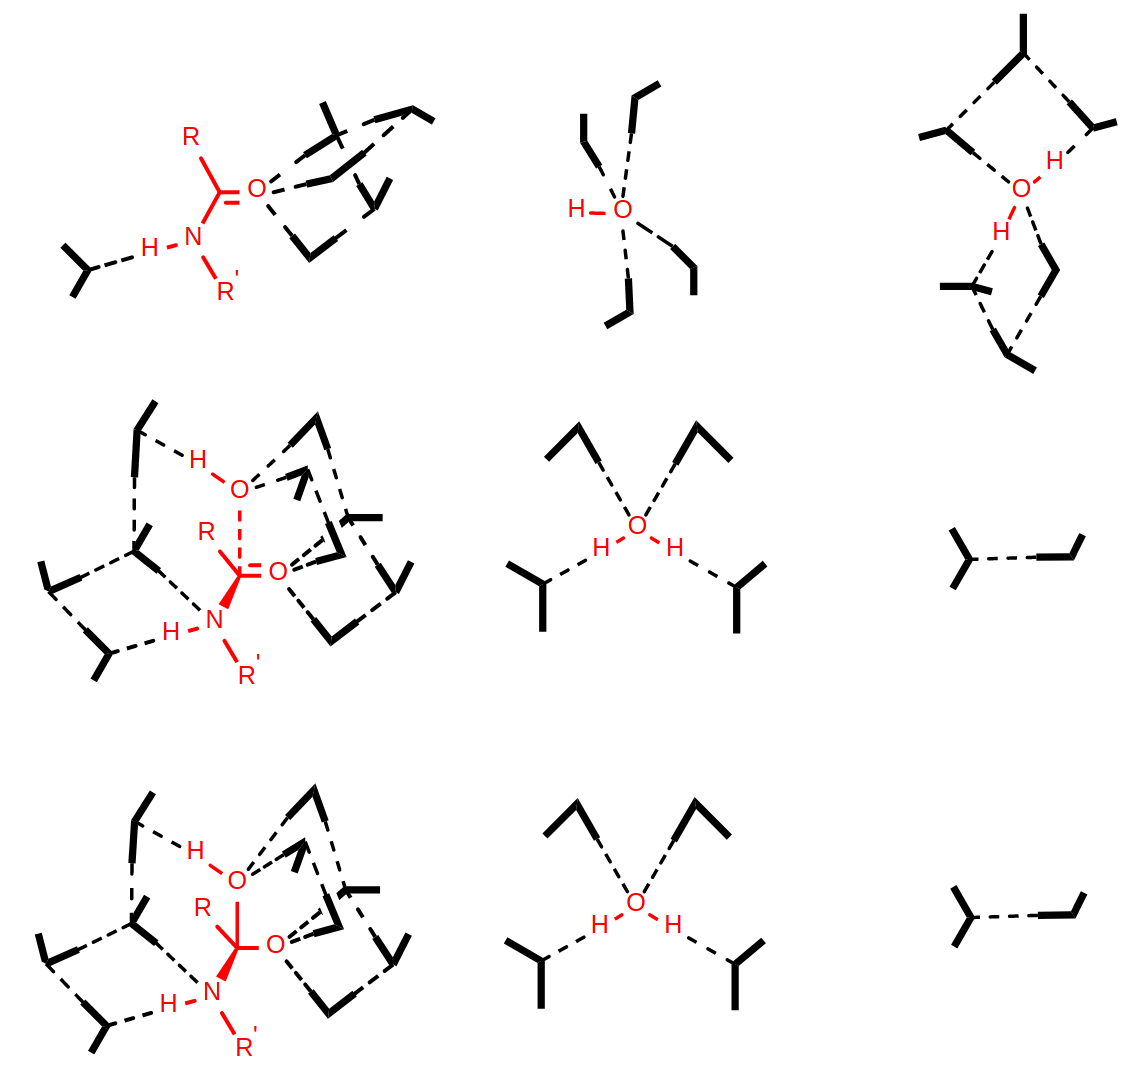
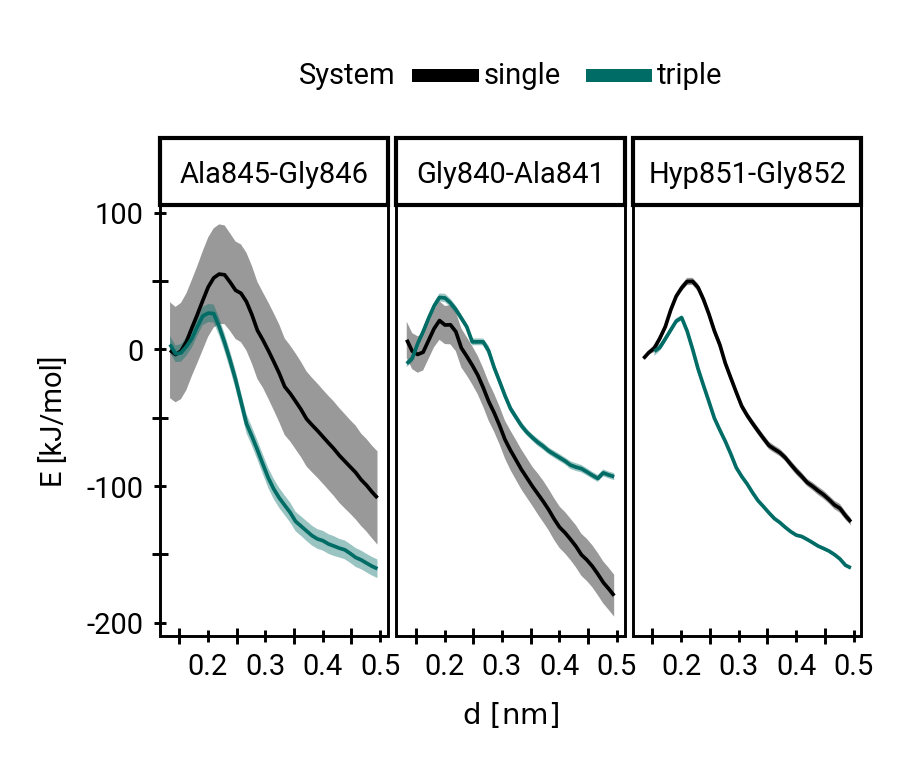
QM/MM simulations reveal mechanistic details of the tetrahedral intermediate formation

QM/MM simulations reveal mechanistic details of the tetrahedral intermediate formation
The triple helix marginally impedes hydroxide attack thermodynamically
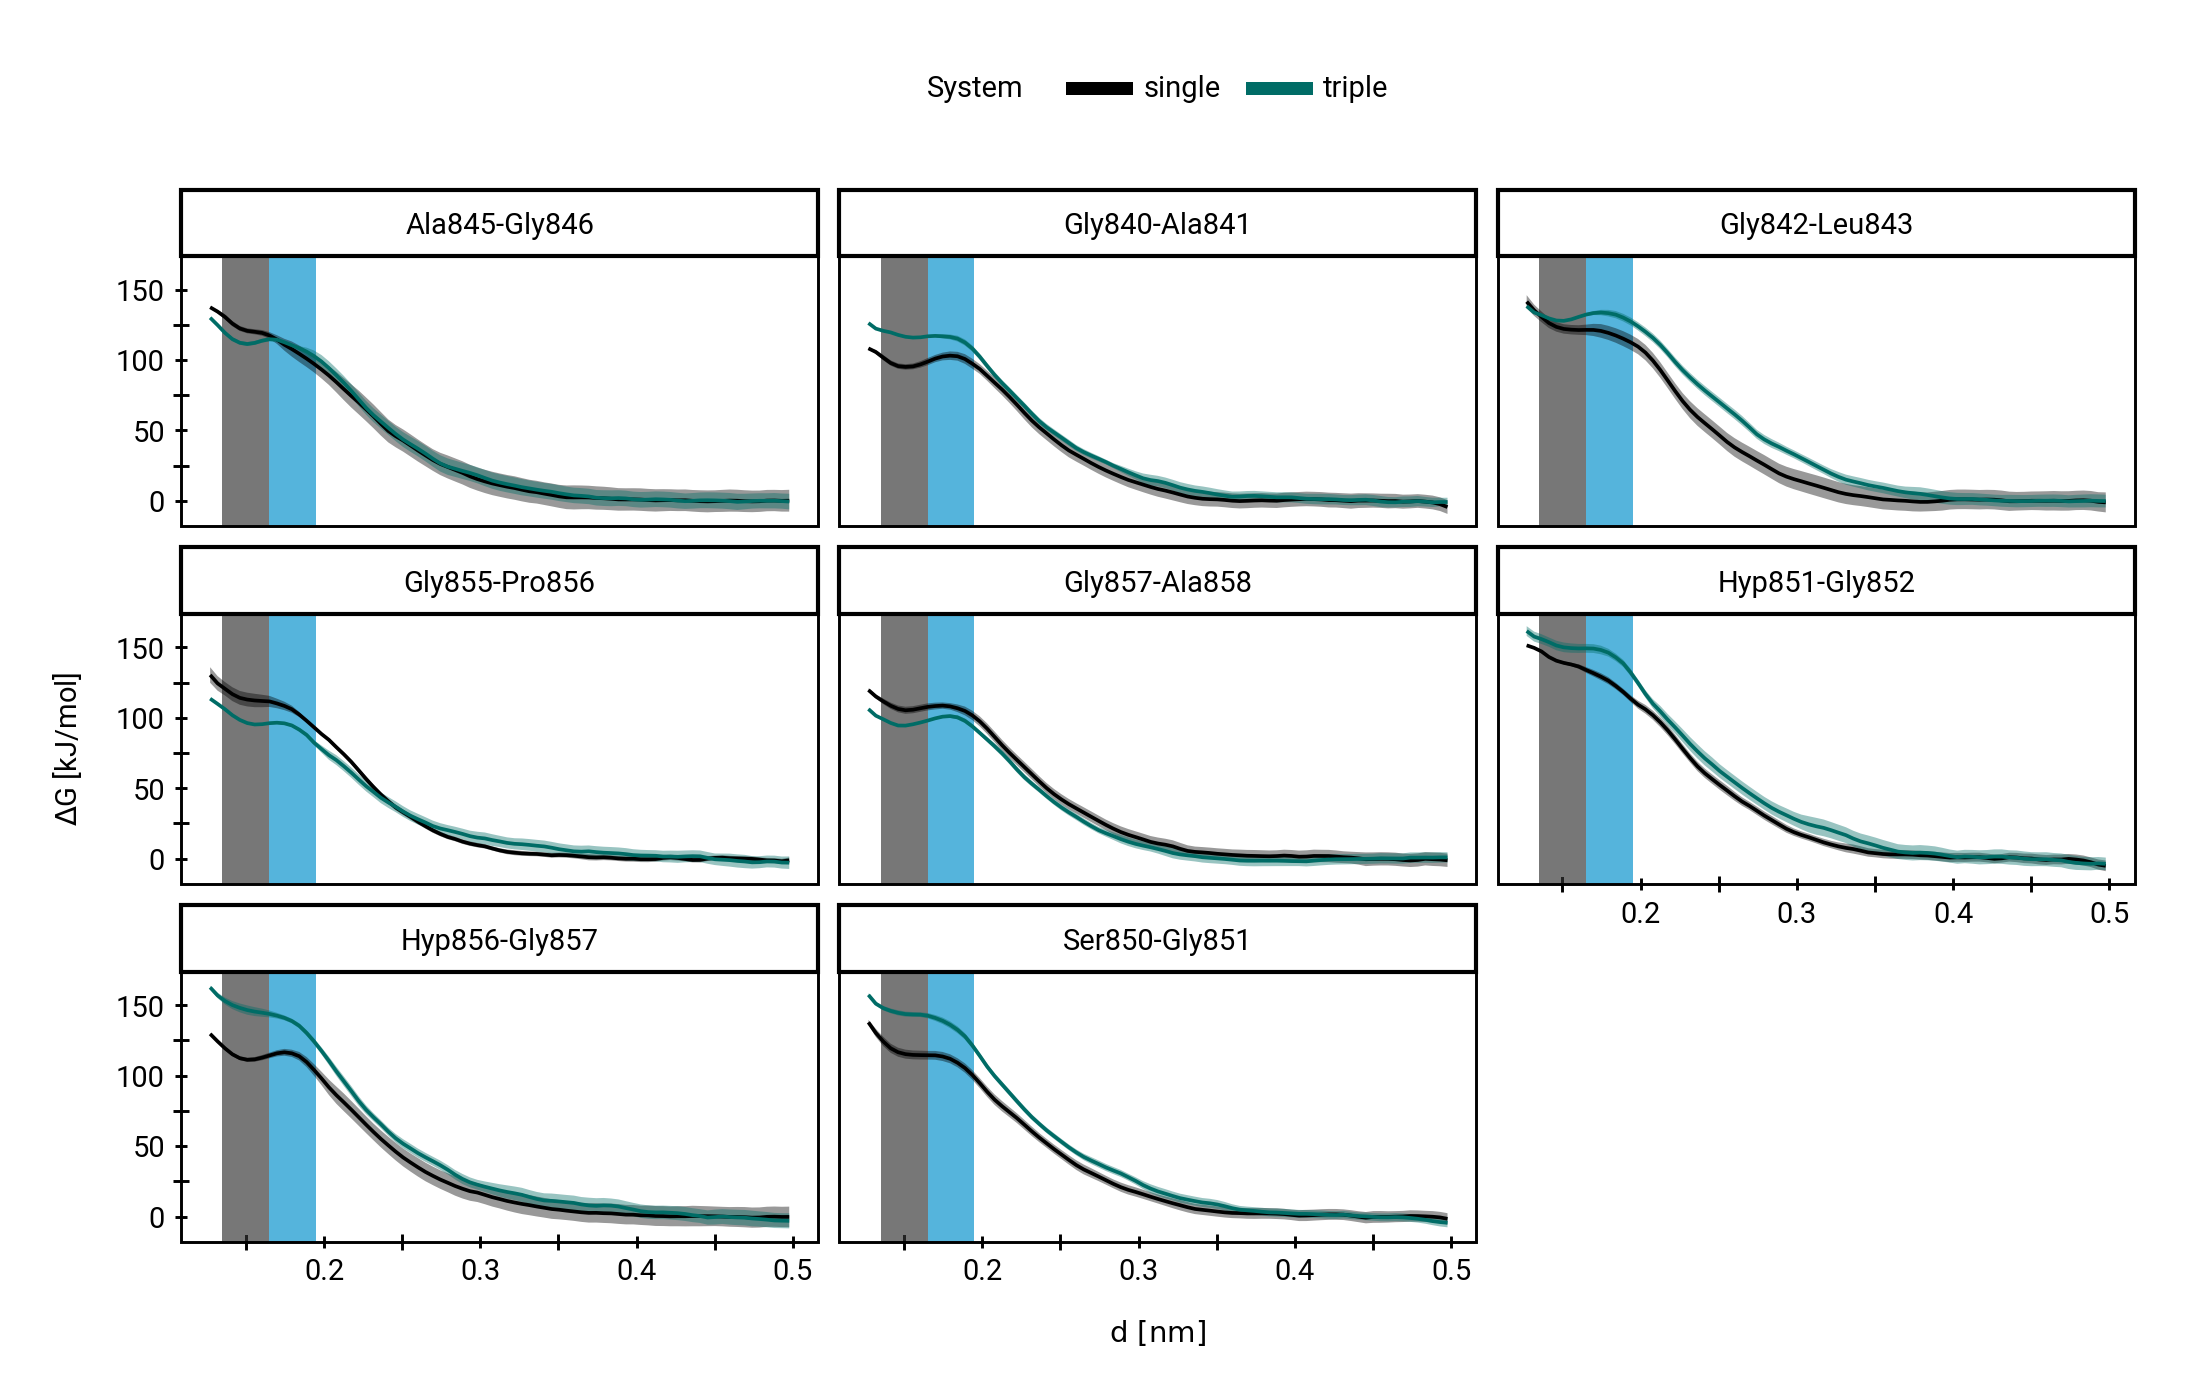
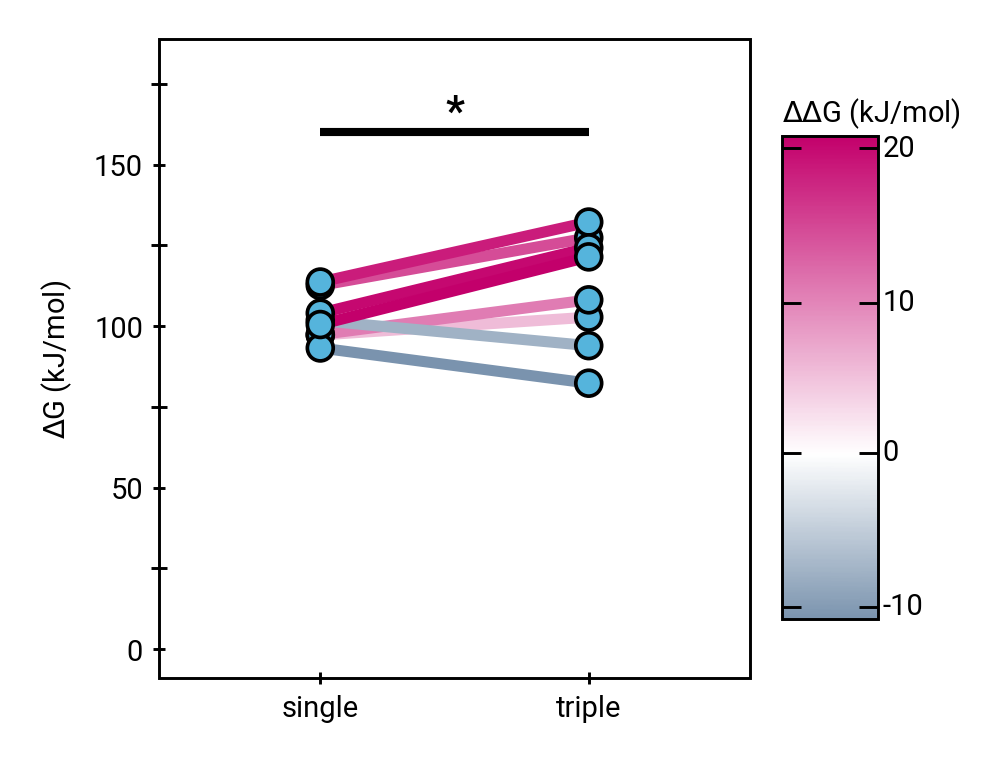
\(\Delta\Delta G\) 9.02 ±4.41 kJ/mol (±SEM)
Rate reduction due to triple helix:
30 to 40 times.
WHAM: Weighted Histogram Analysis Method [6]
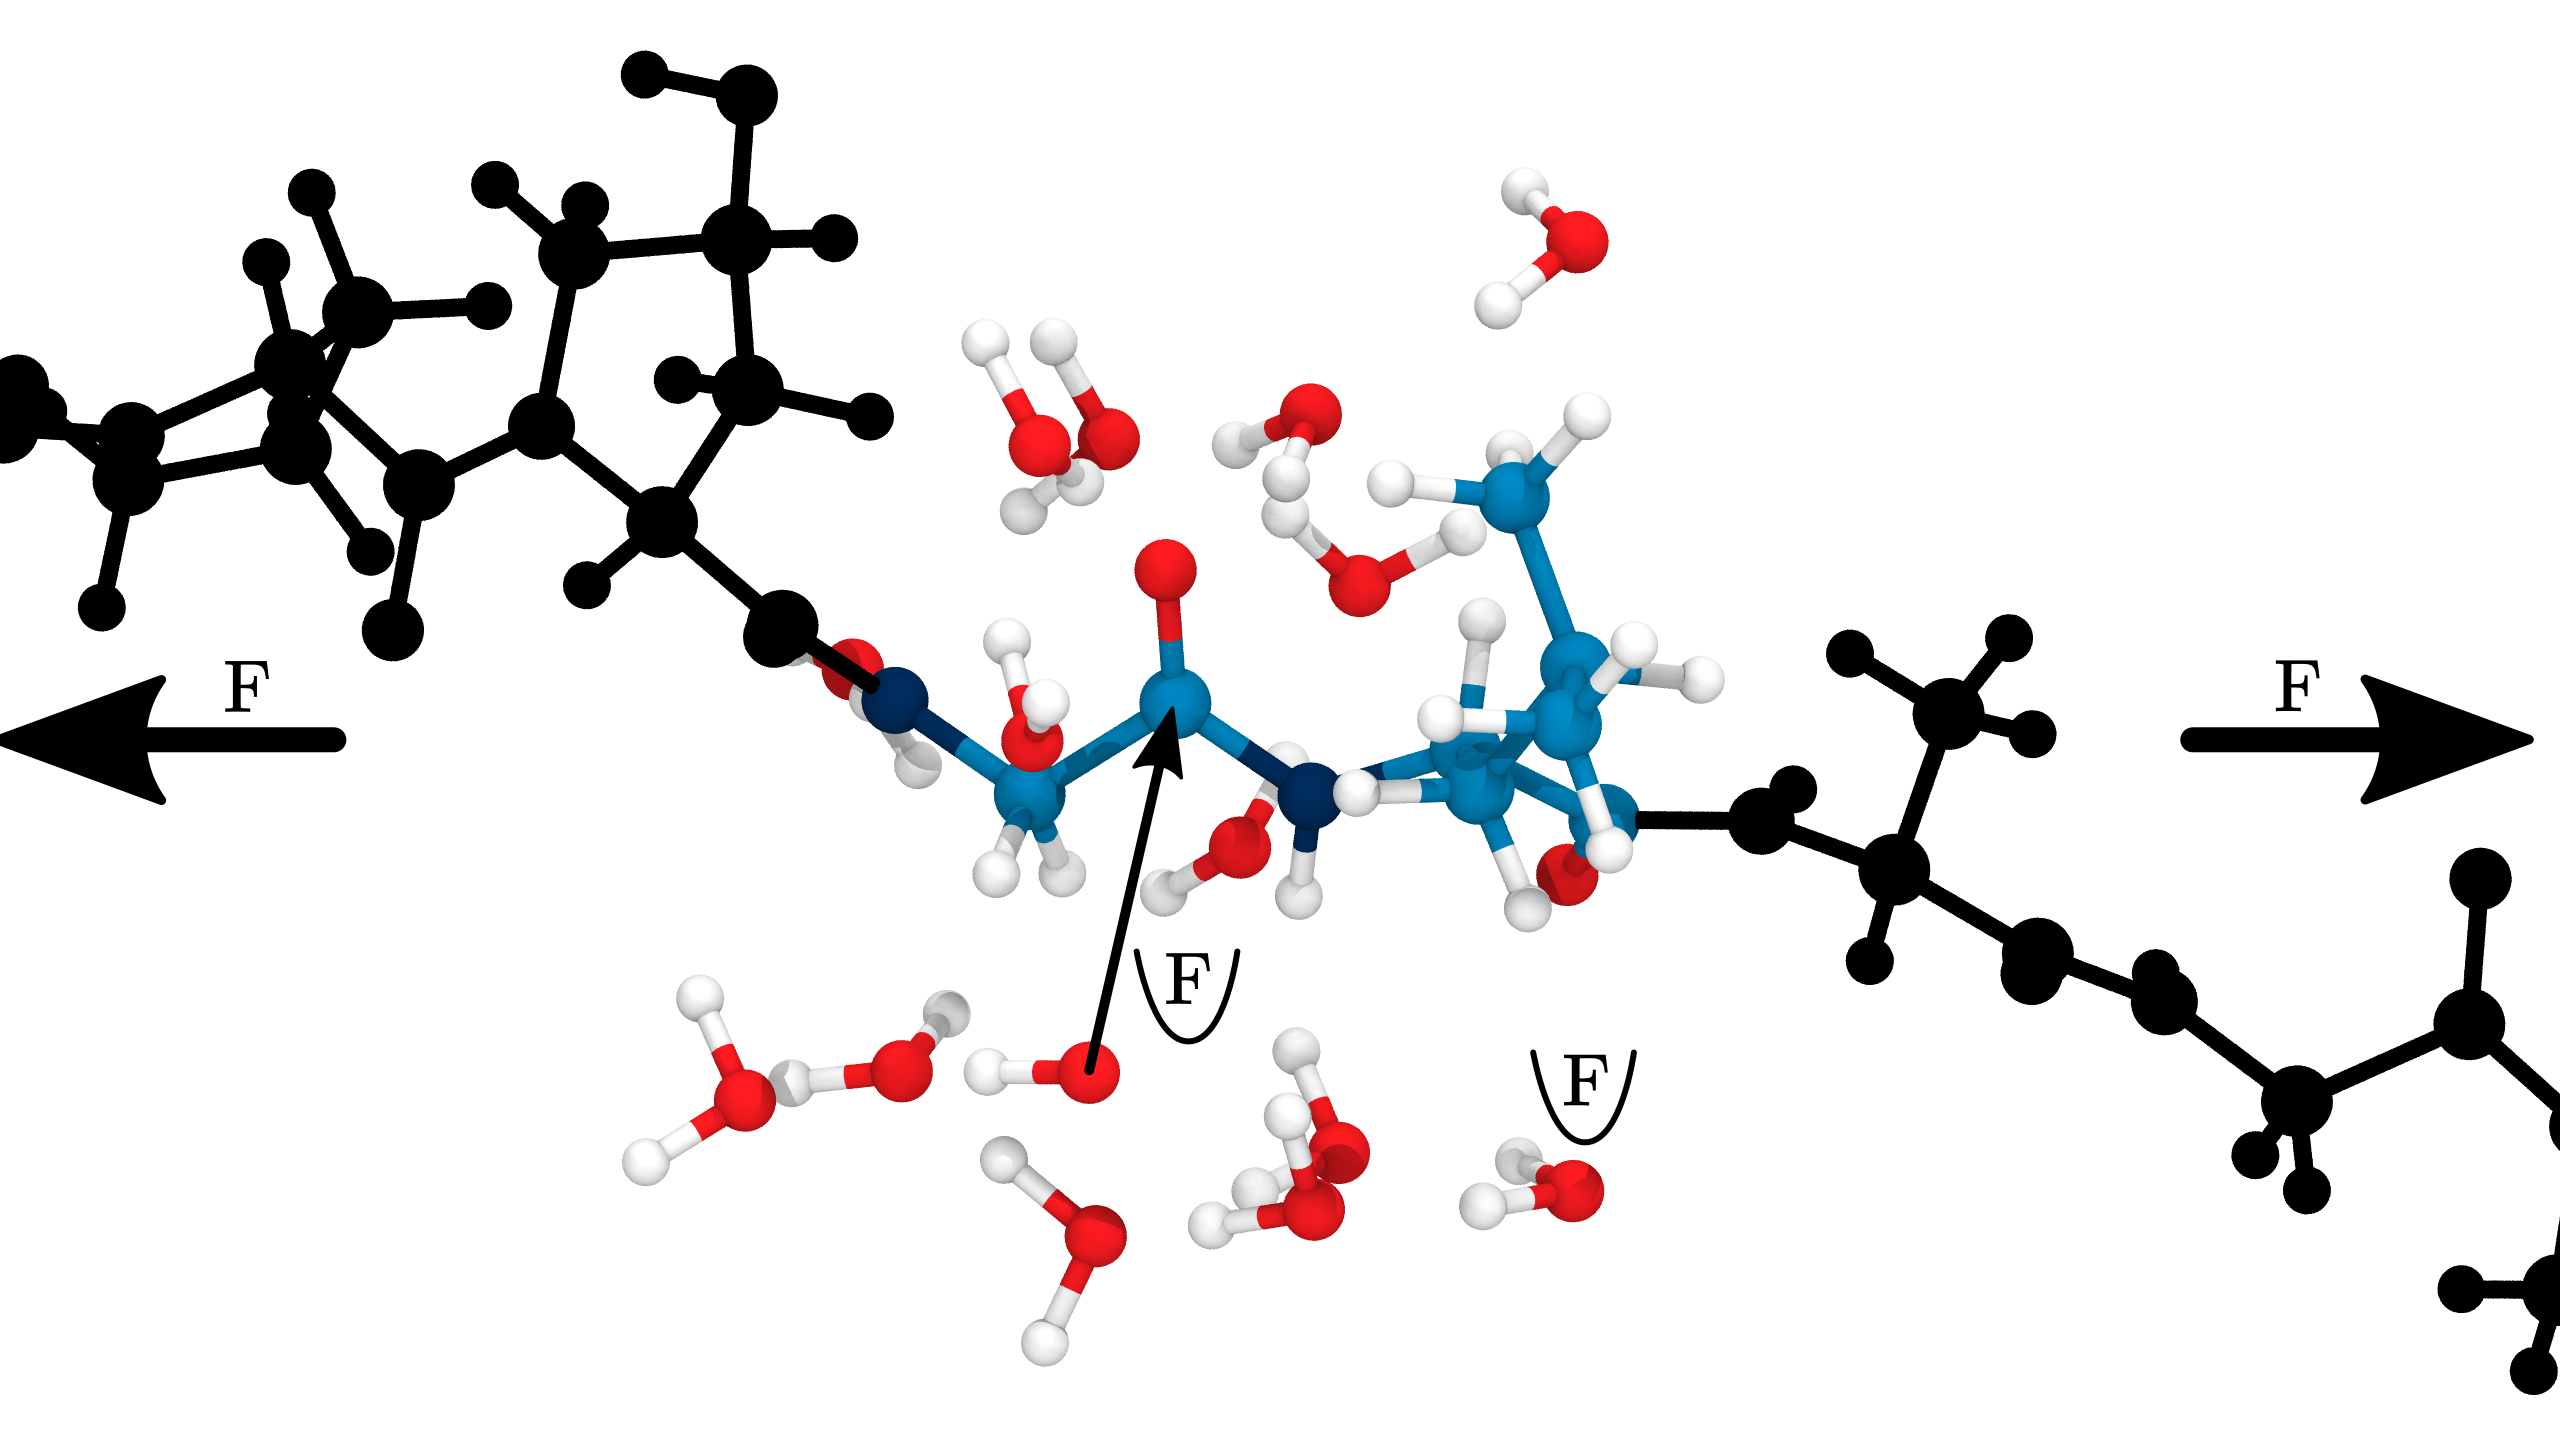
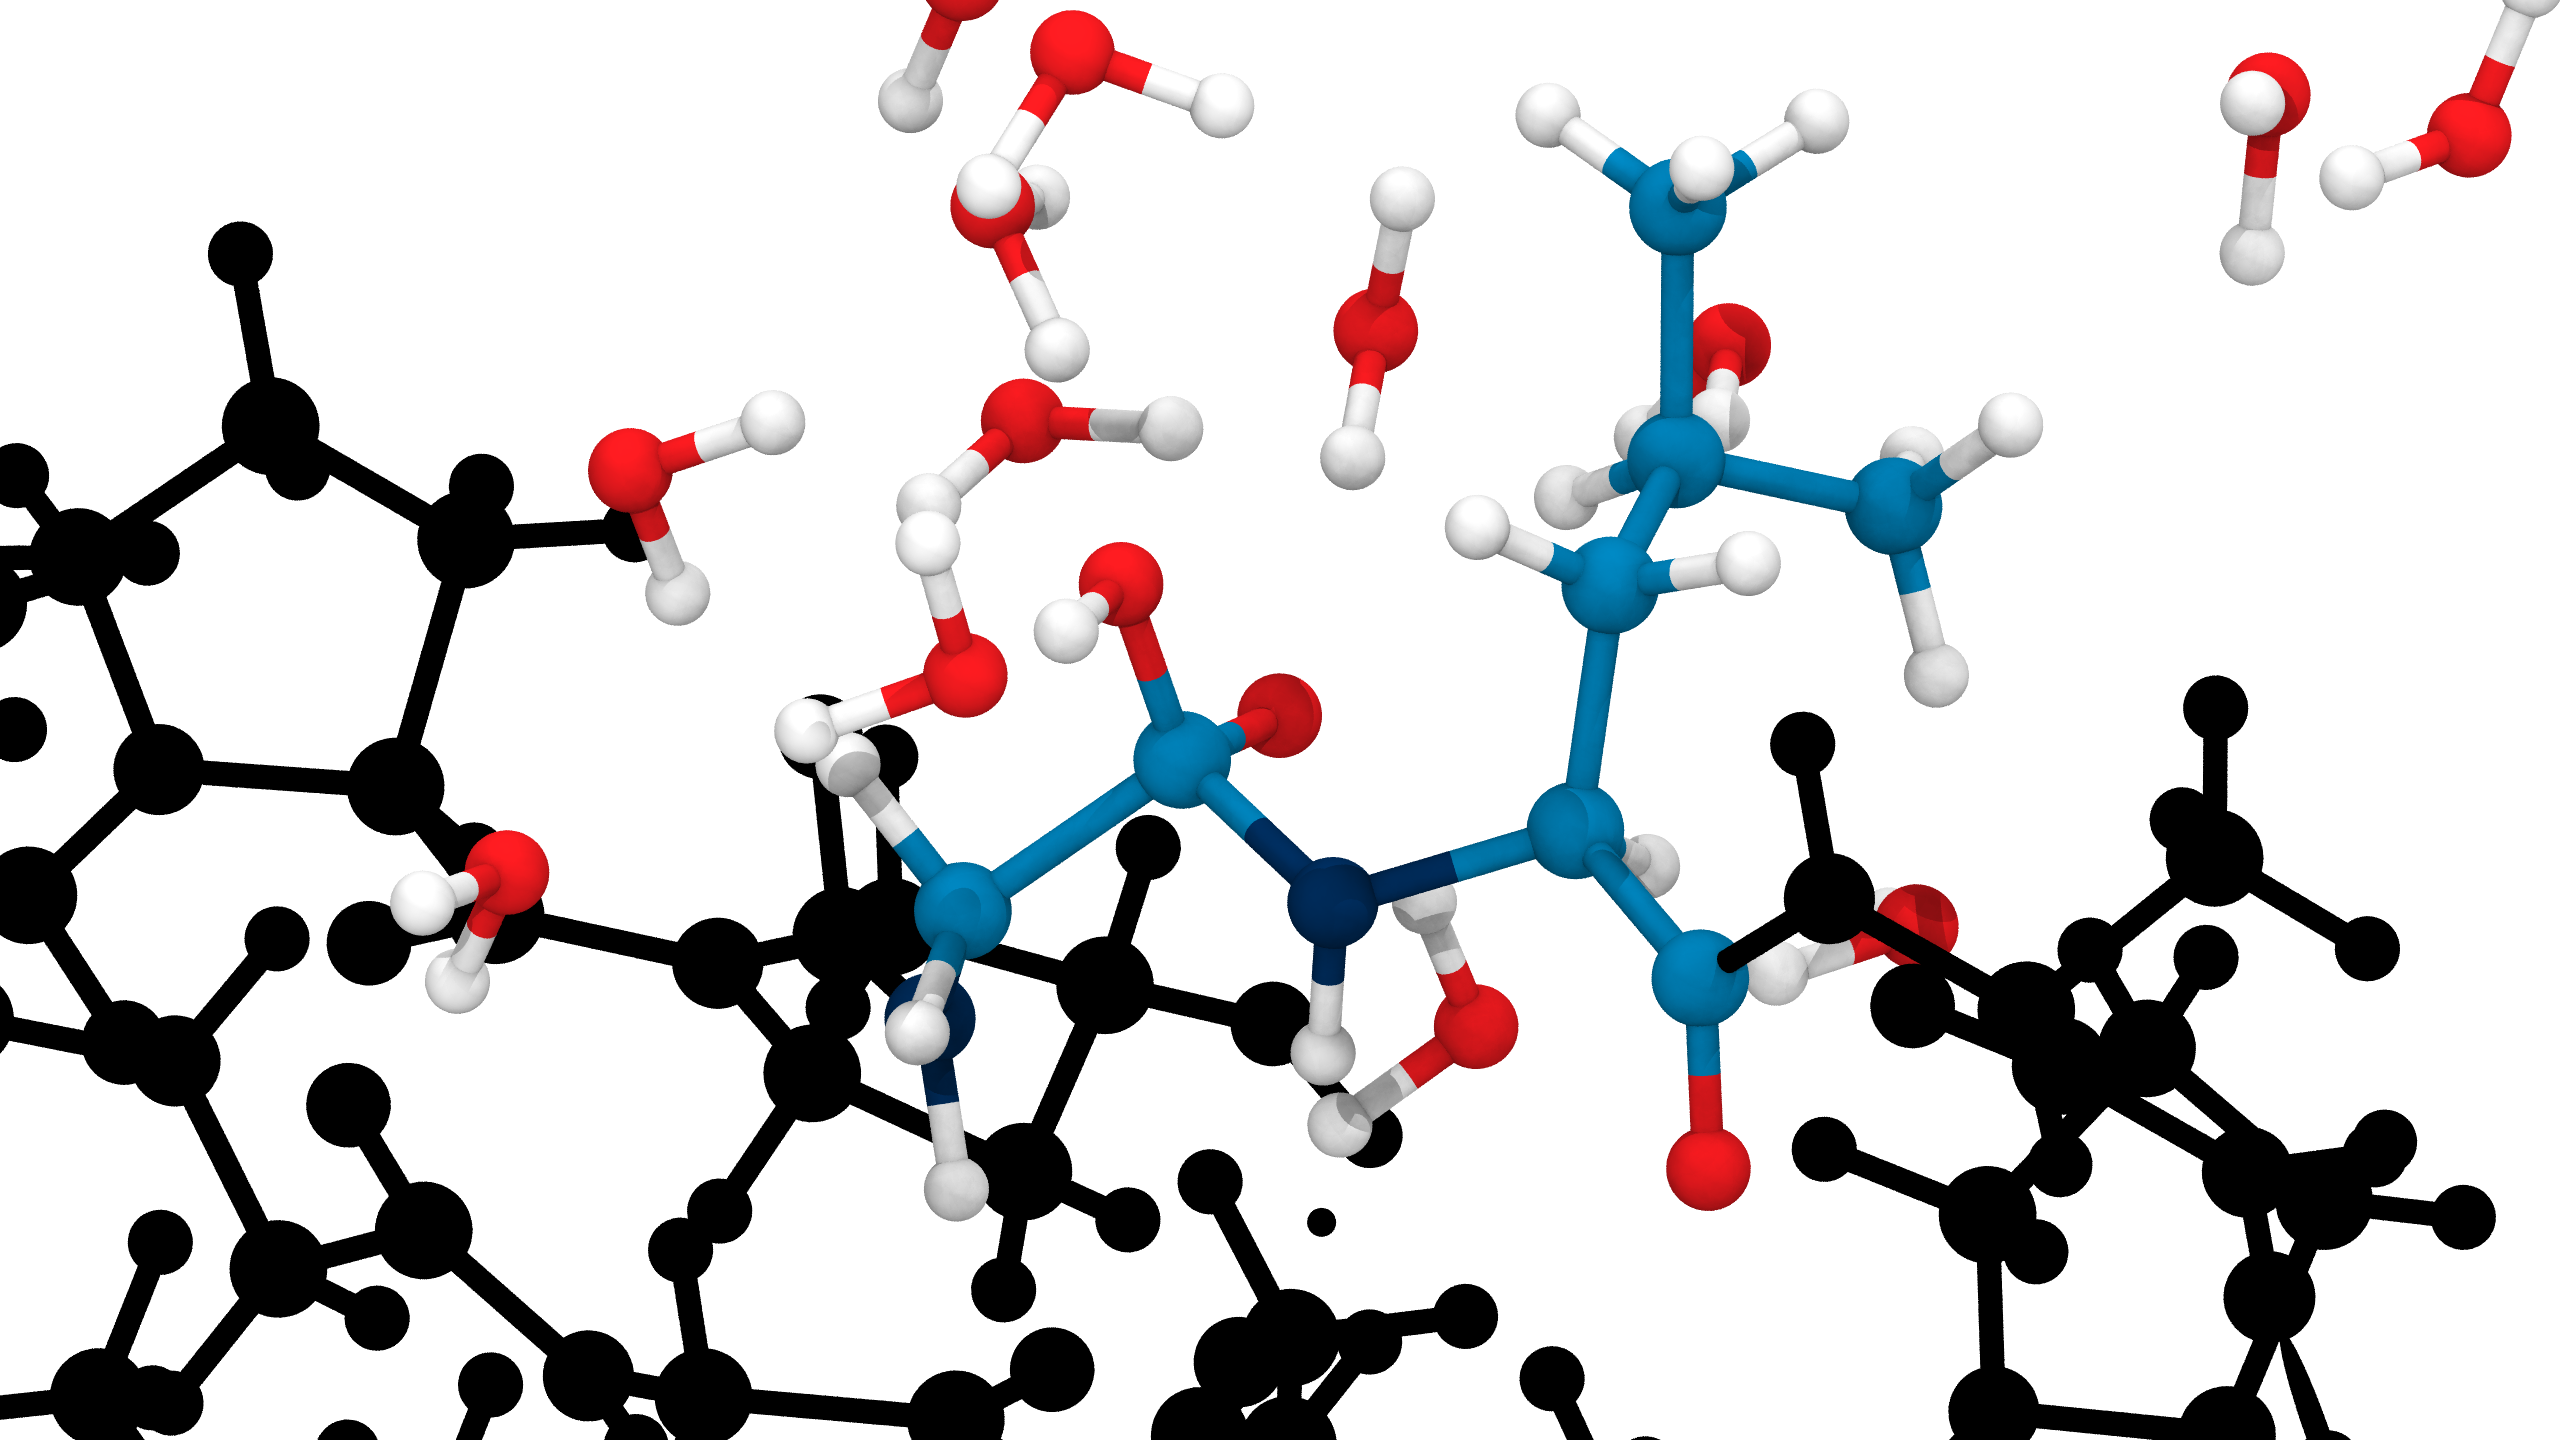
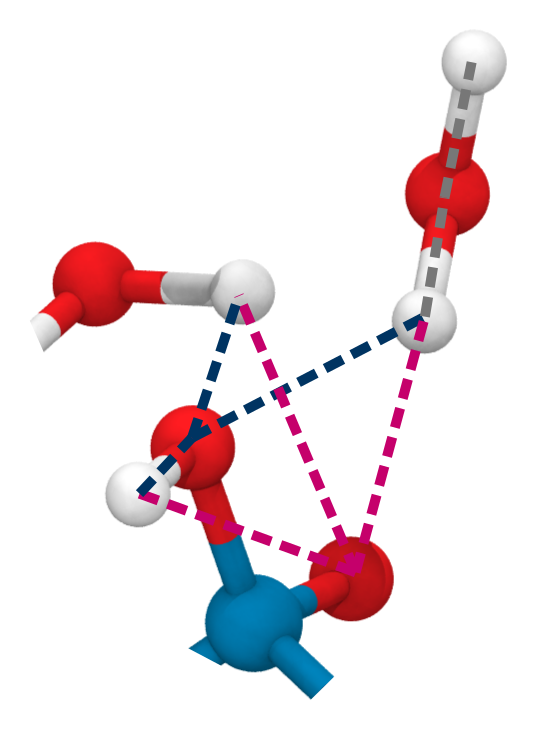
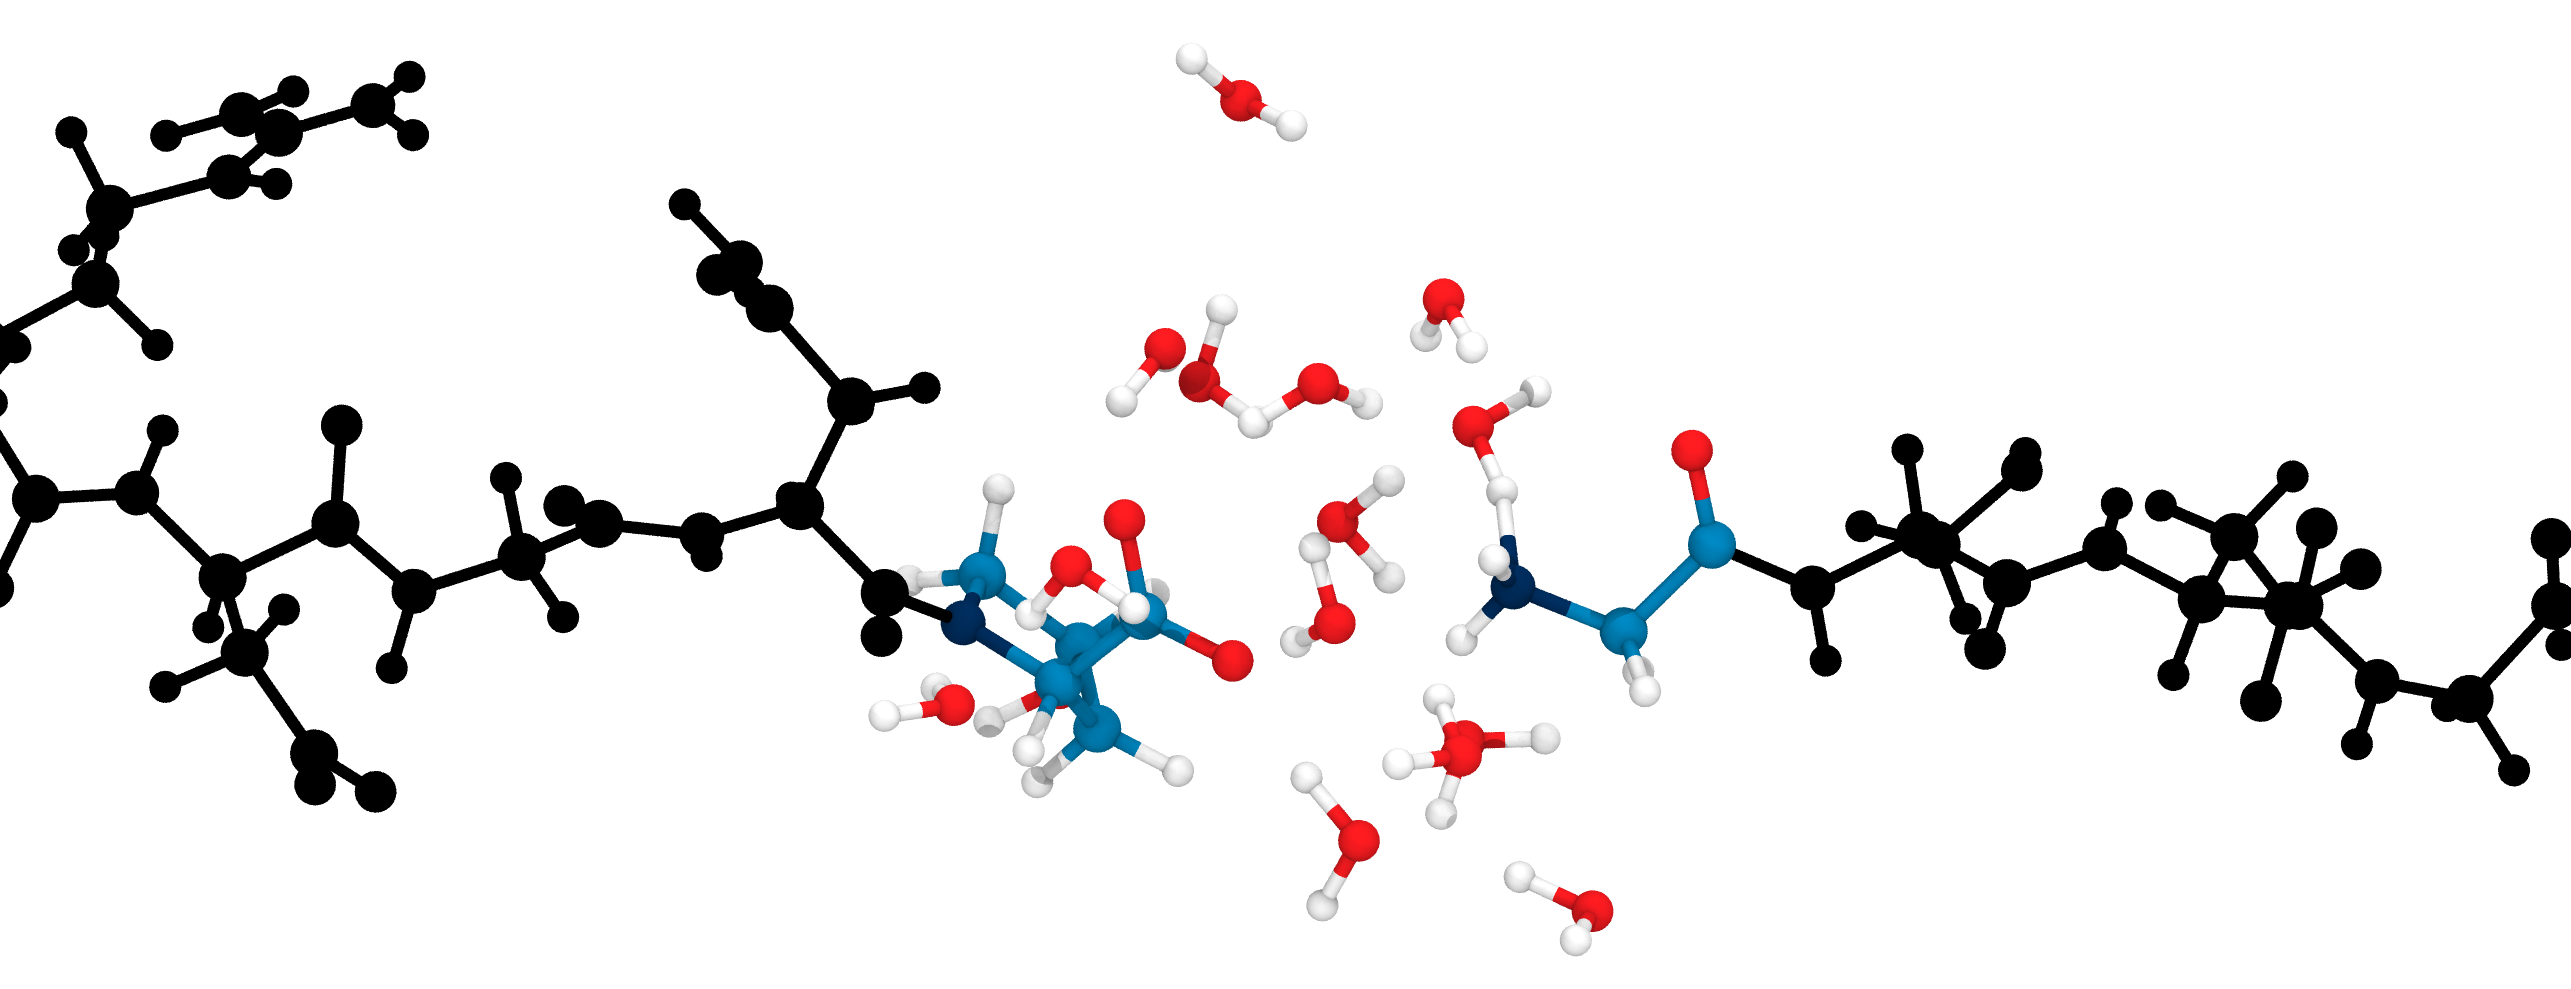
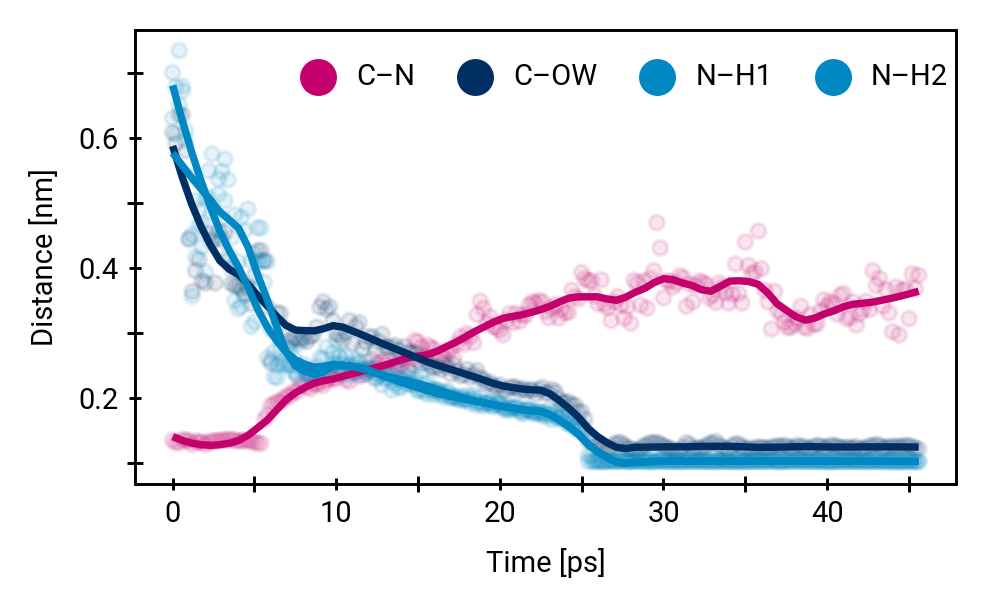
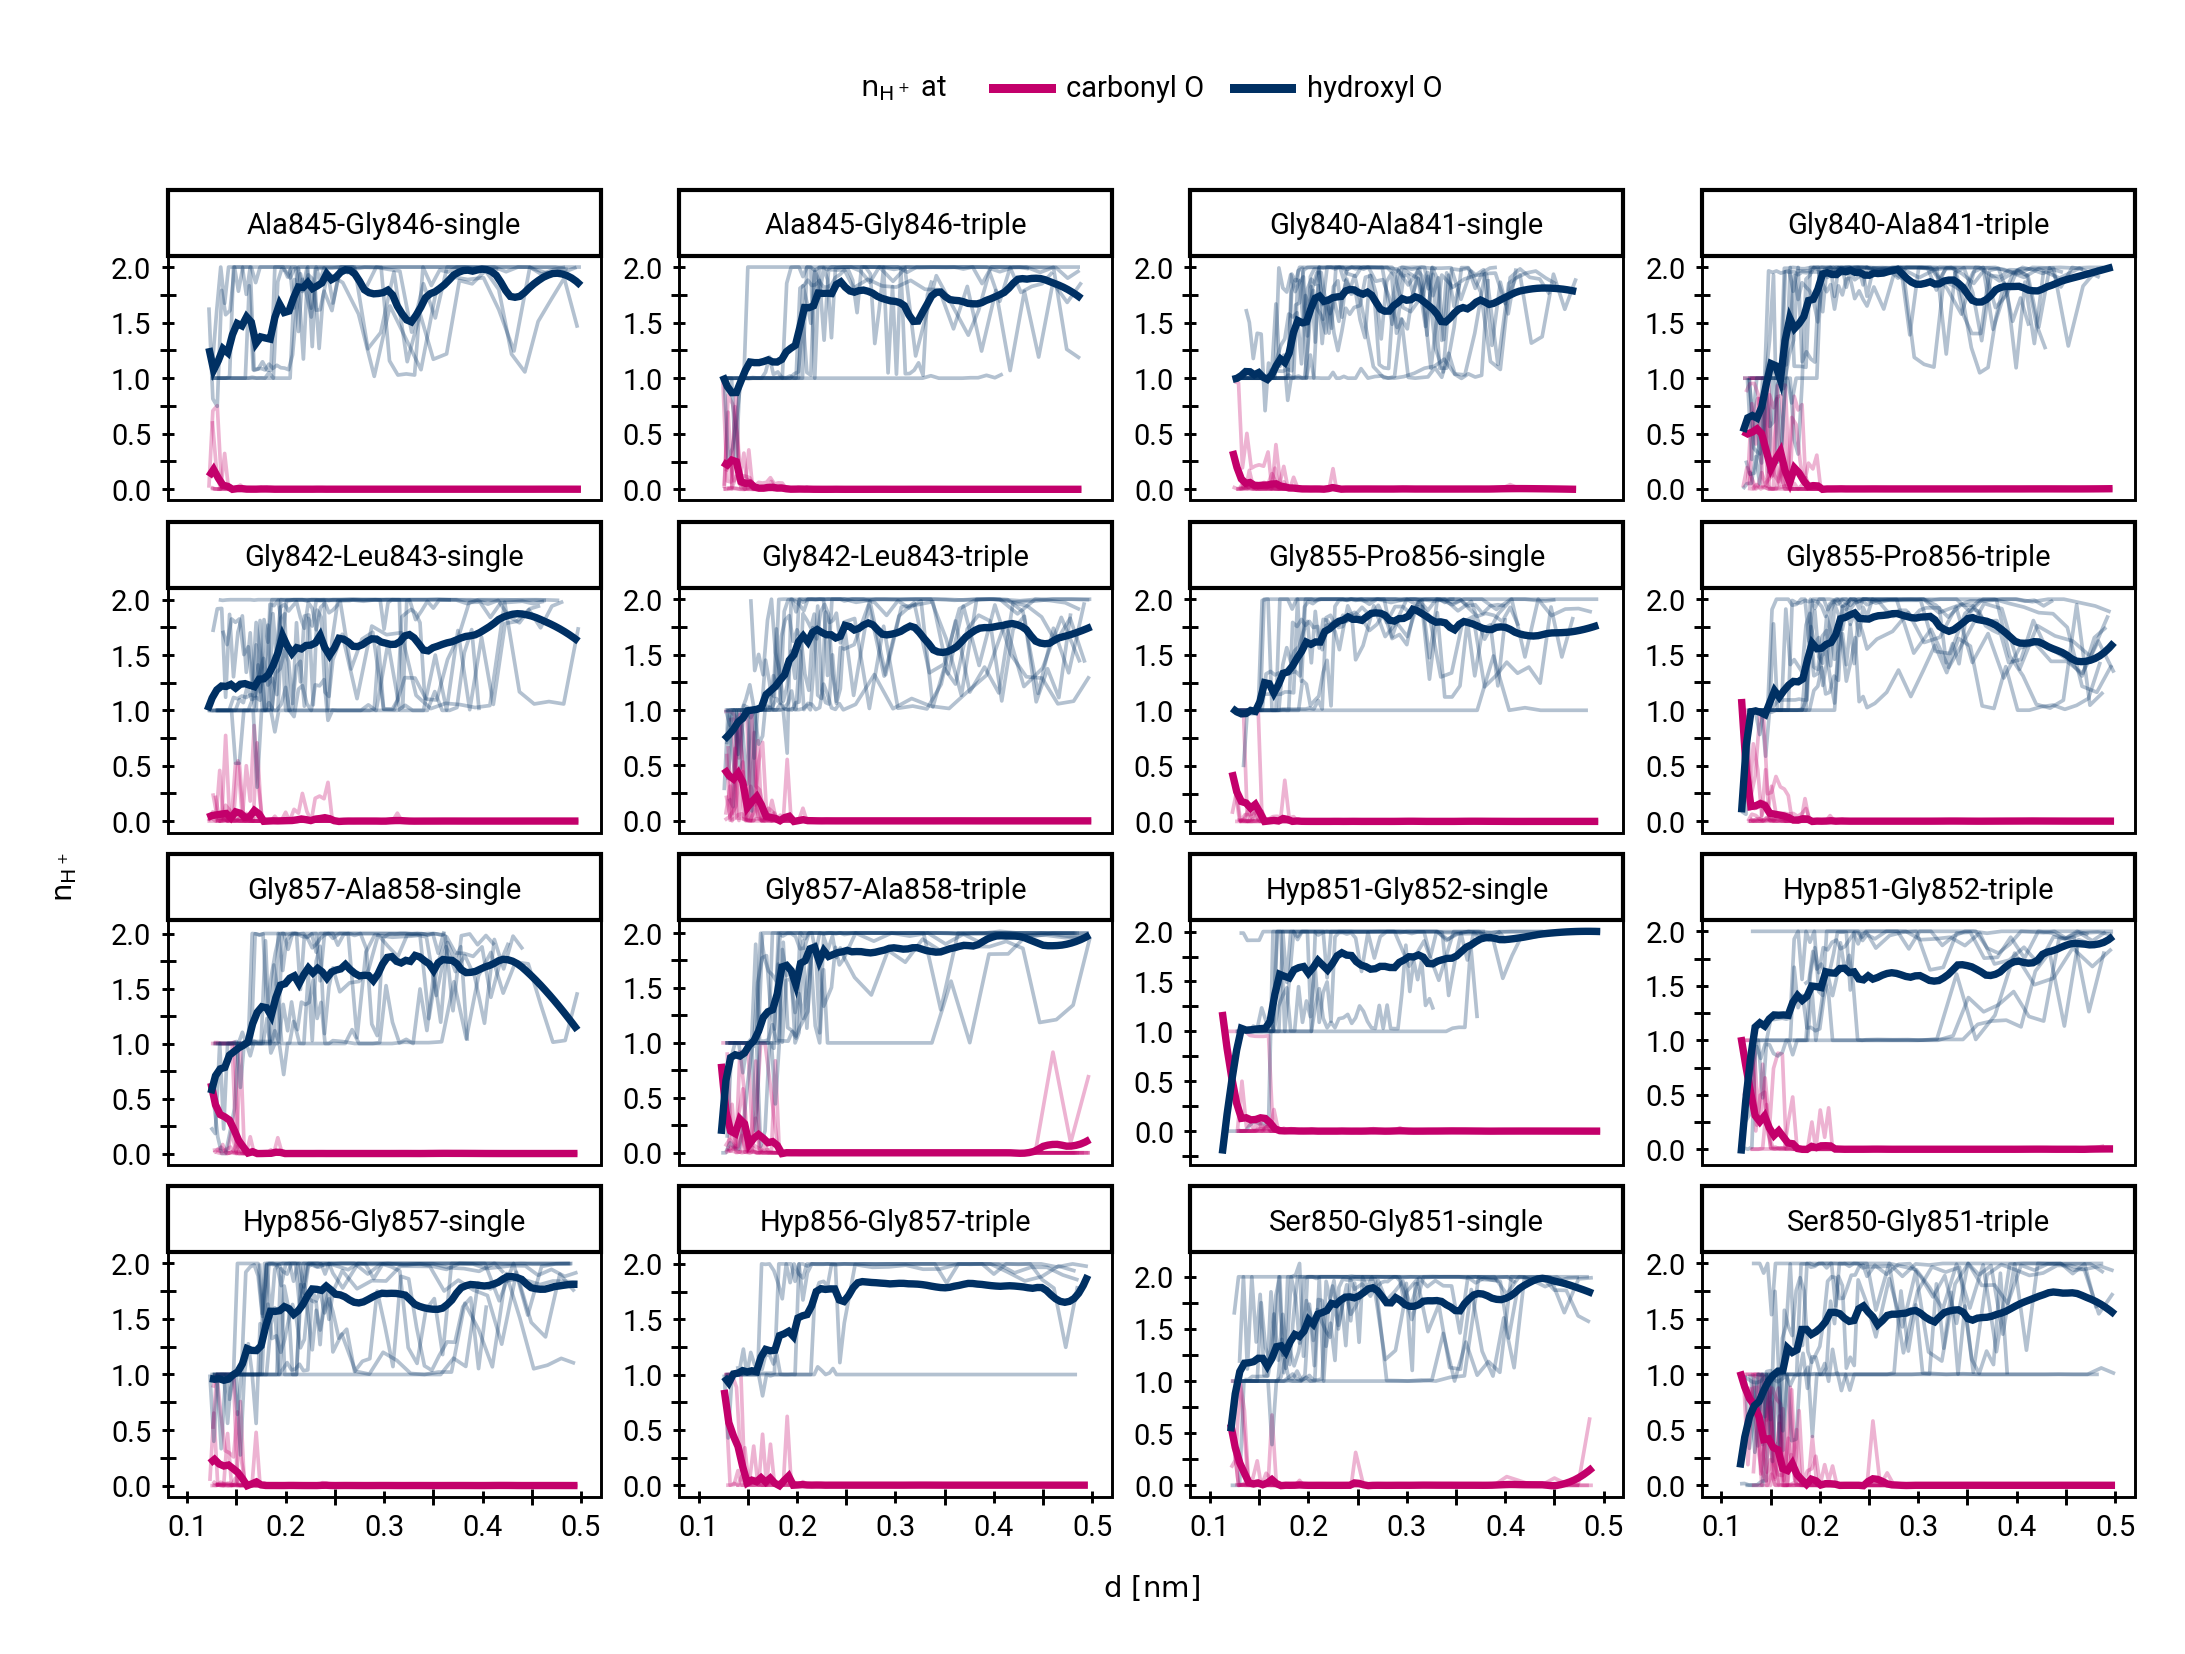
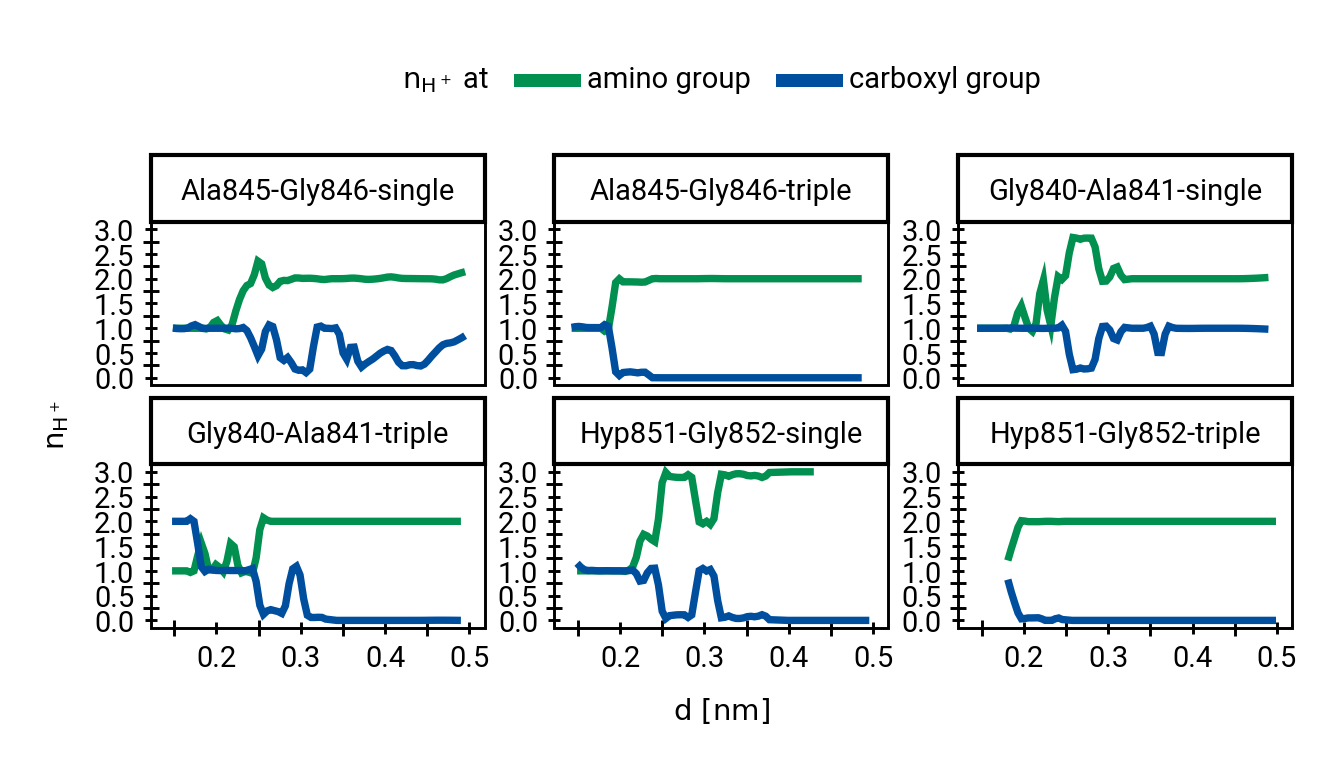
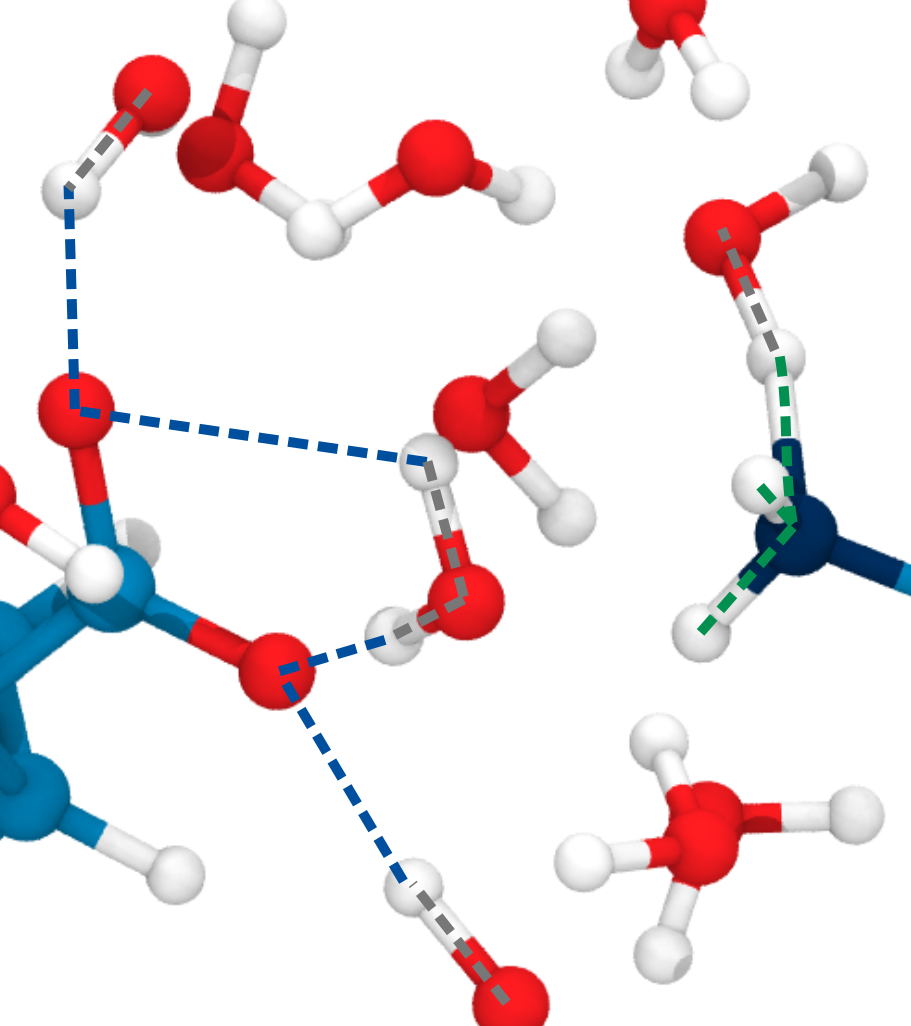
Proton mobility in explicit QM solvent molecules allows breaking of the peptide bond

Discussion of QM/MM results
- Currently in peer review at The Journal of Physical Chemistry B
- Survivorship bias

- Effect size
\(\Delta\Delta G\) 9.02 ±4.41 kJ/mol (±SEM)
- Computational cost!
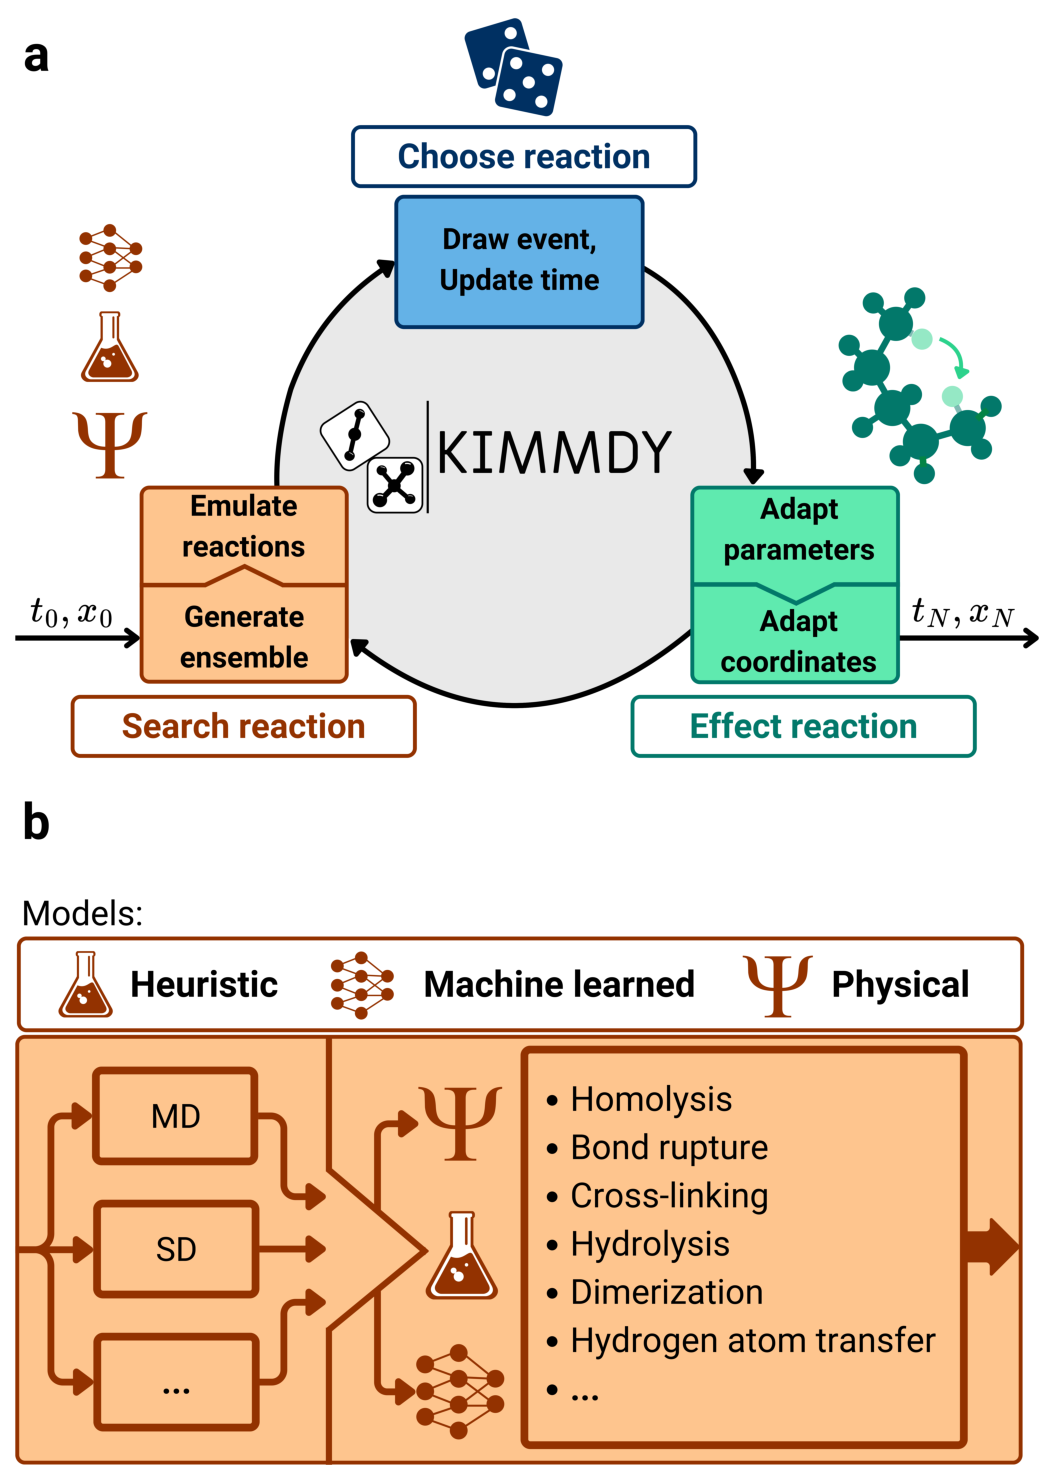
Kinetic Monte Carlo Molecular Dynamics: KIMMDY
with Eric Hartmann and Kai Riedmiller,
inspired by Benedikt Rennekamp [7]
graeter-group.github.io/kimmdy/
Read now on bioRxiv:
KIMMDY: A biomolecular reaction emulator [8],
or soon in Nature Communications.

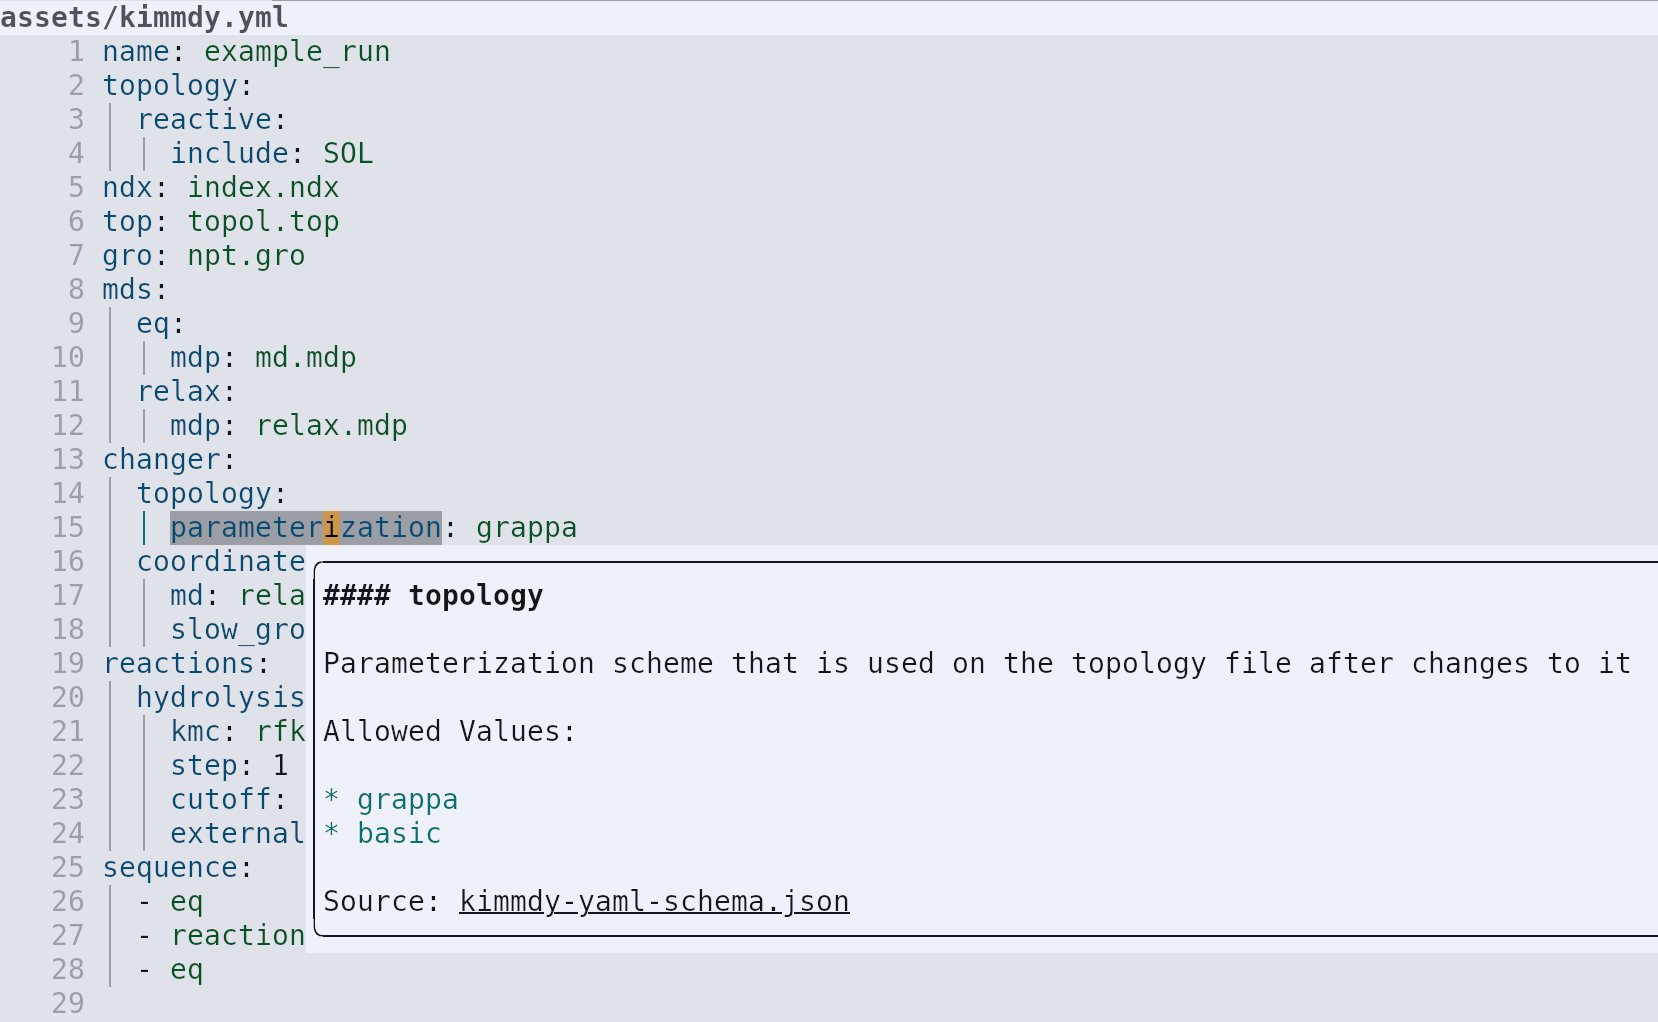
KIMMDY is easy to extend to new chemistries


KIMMDY takes care of the complicated topology modifications.
Parametrization interface to obtain parameters after a reaction
Graph Attentional Protein Parametrization by Leif Seute [9]
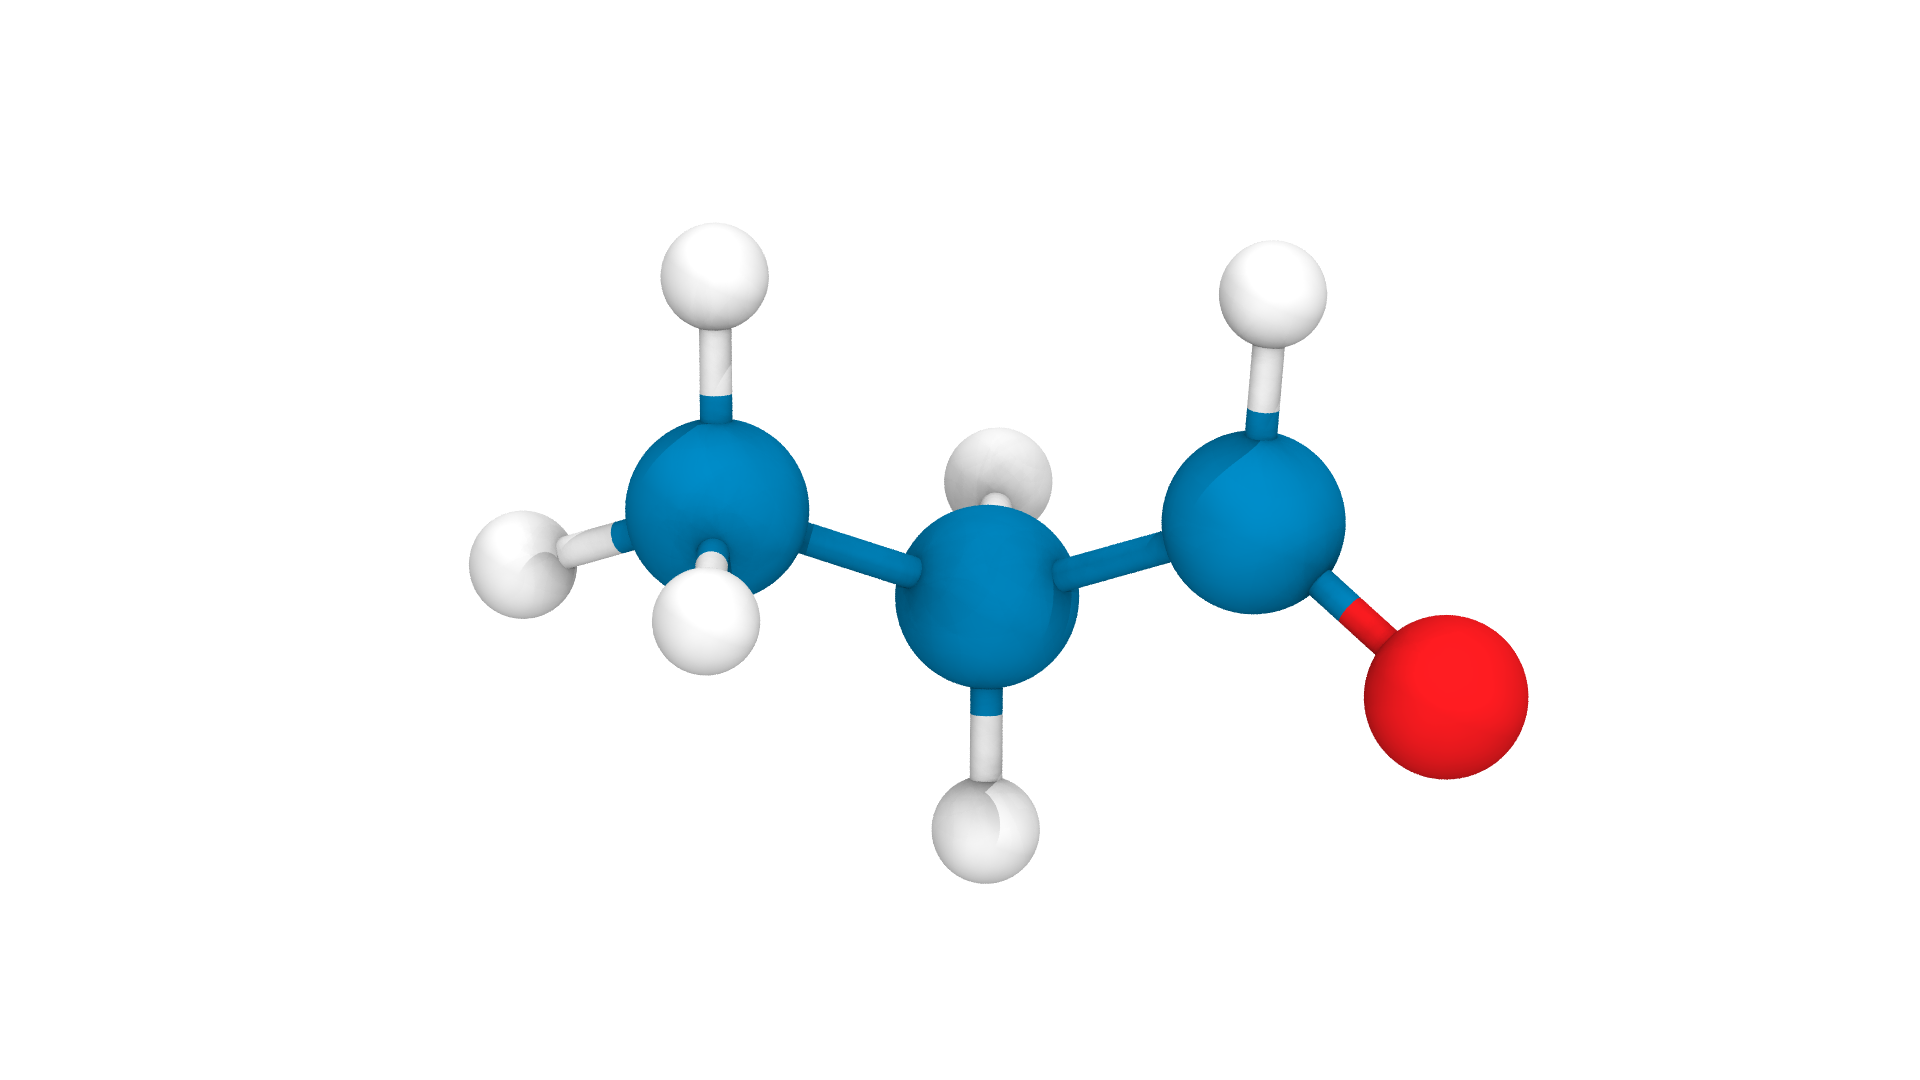
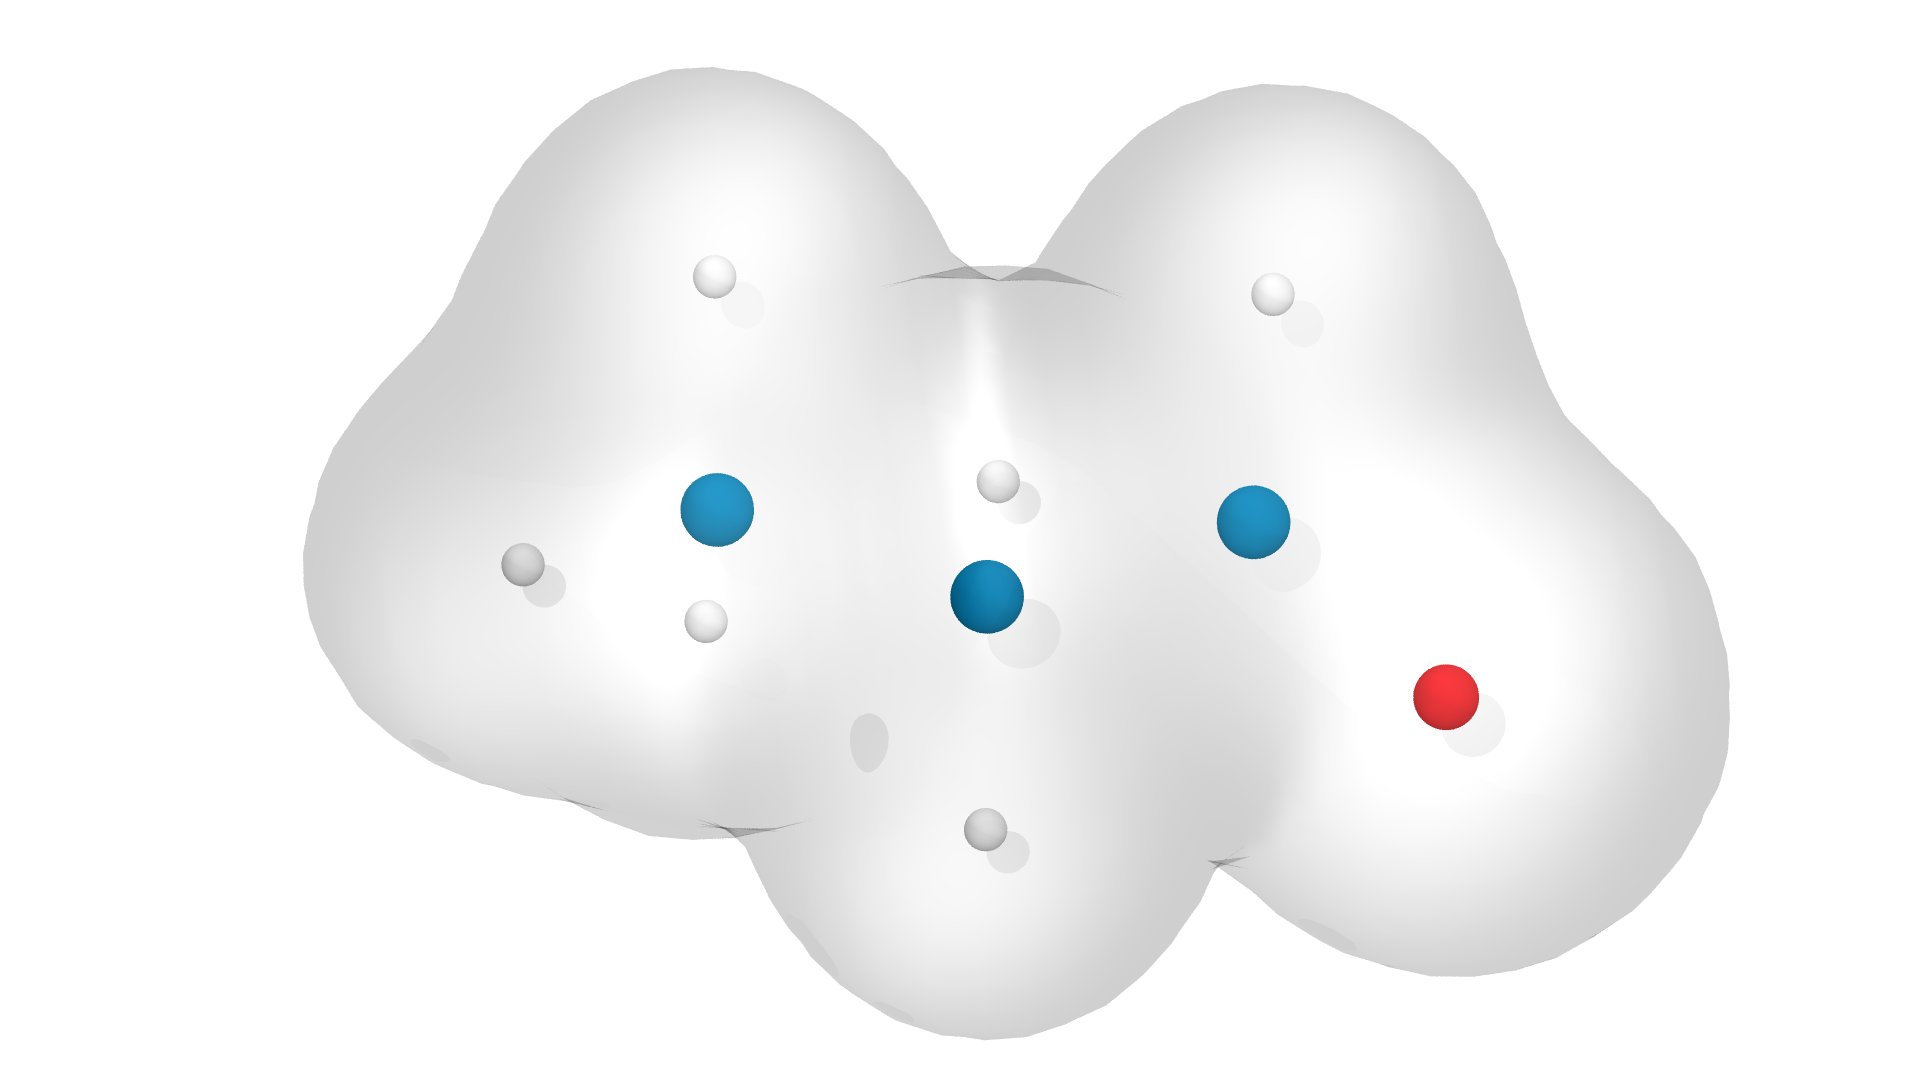
also a good excuse to show the mol* plugin I wrote for our documentation
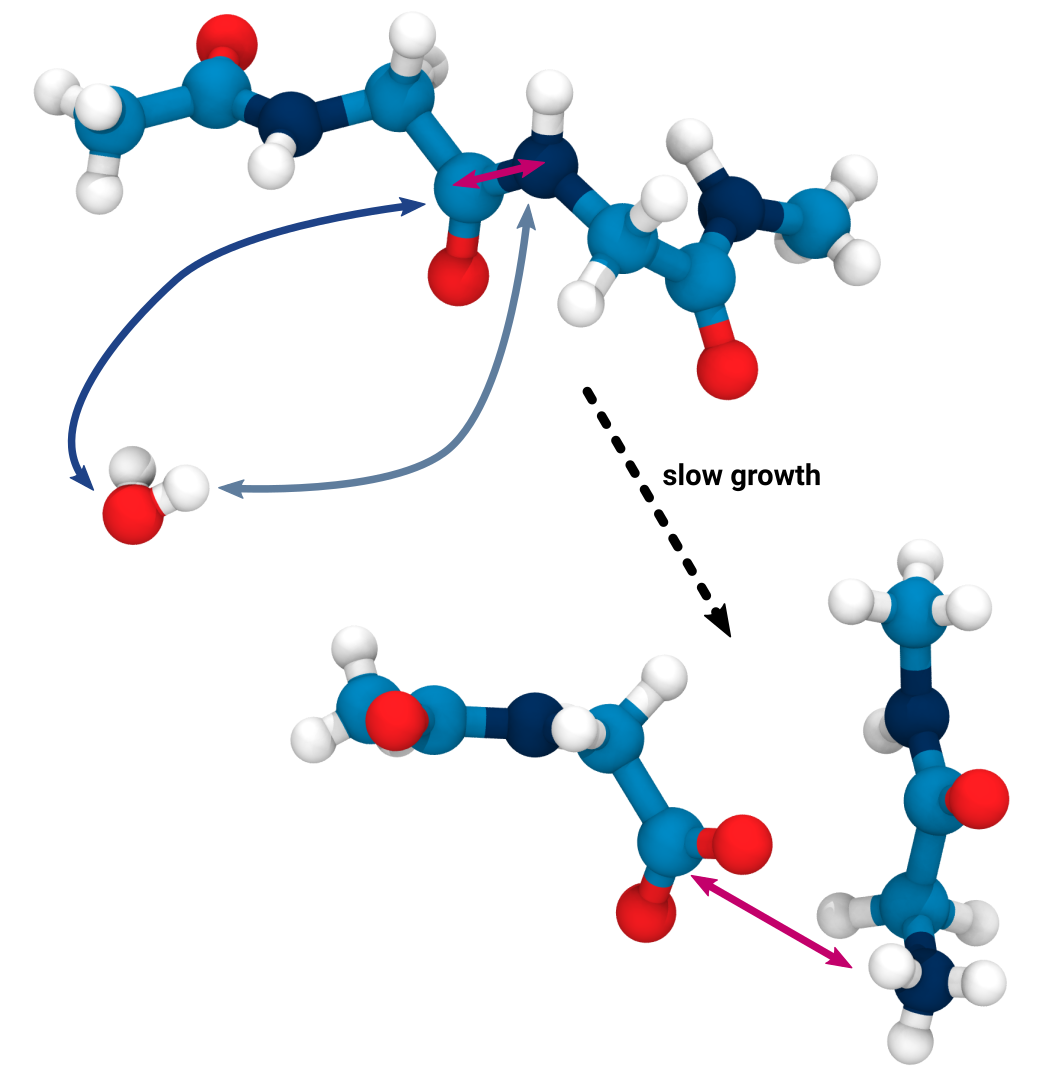
Slow-growth to execute even complex reactions like hydrolysis
Does not have to follow the chemically
accurate reaction coordinate
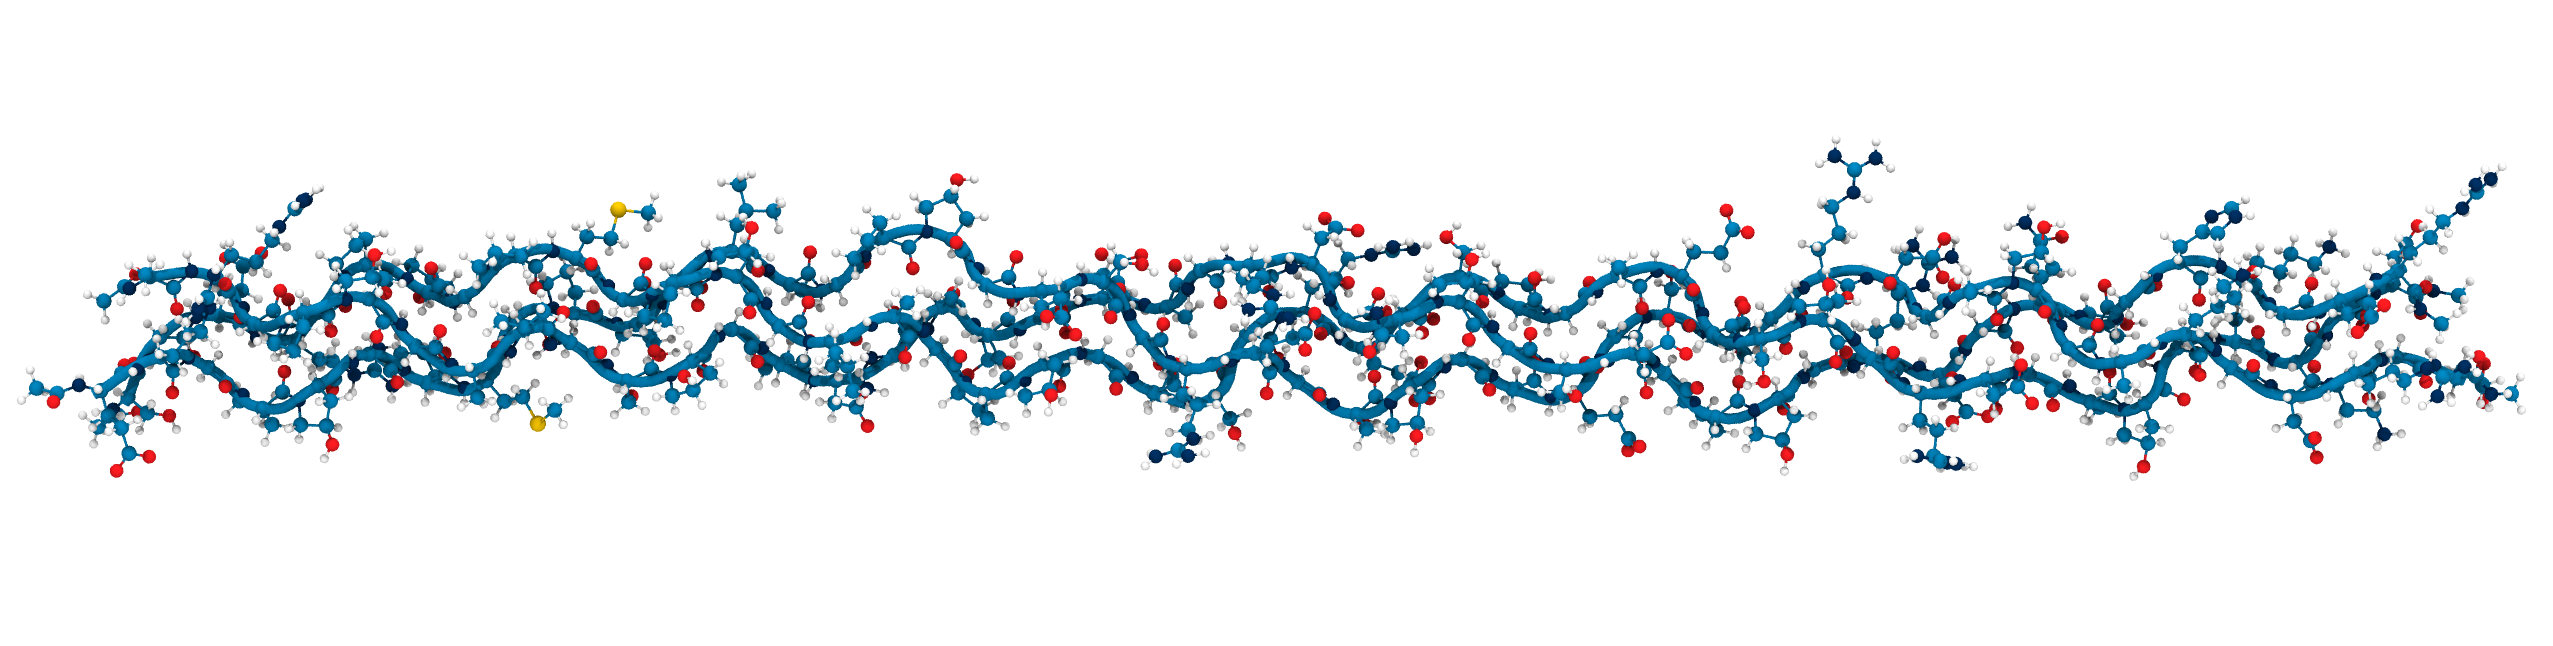
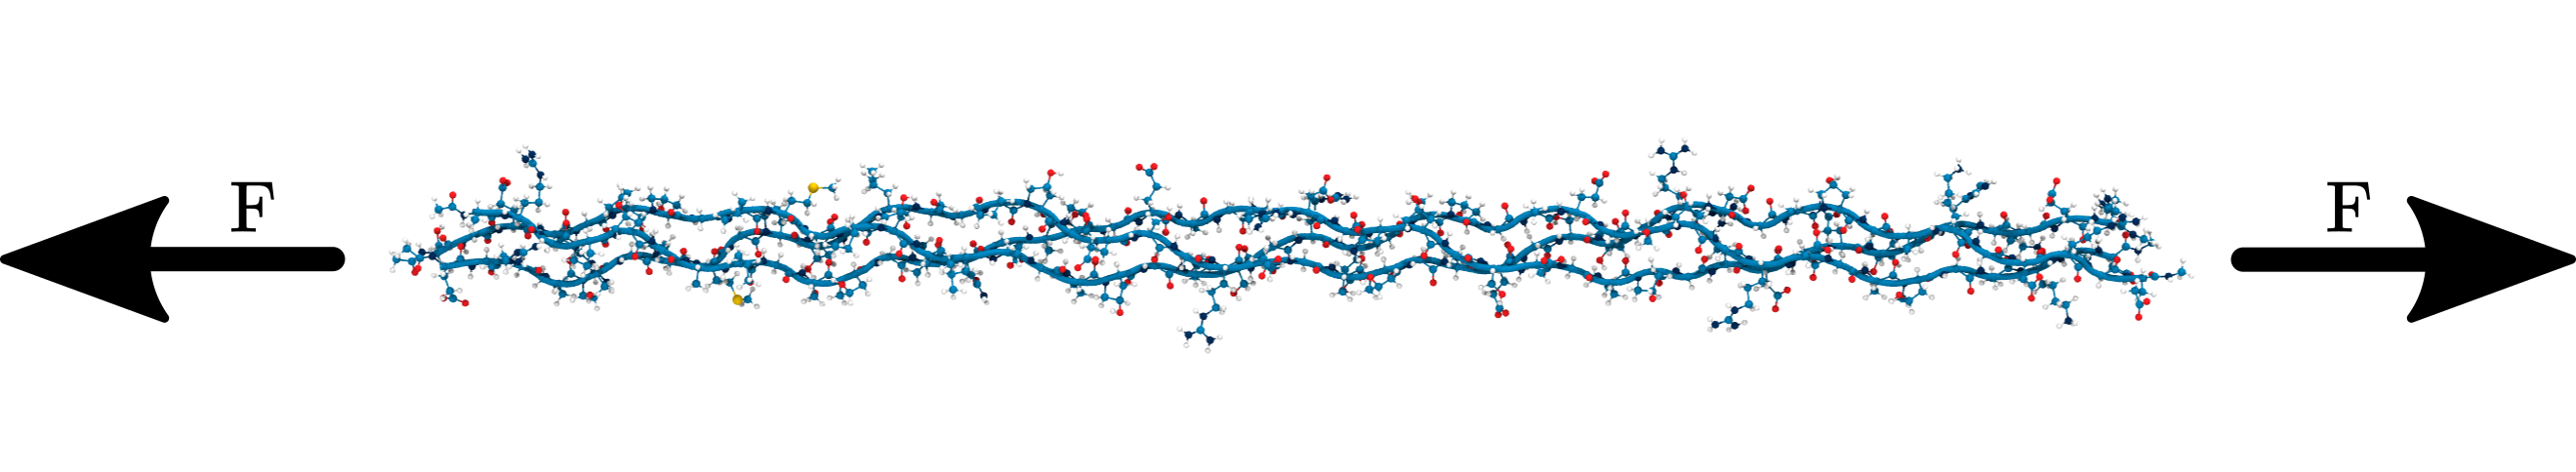
Applying KIMMDY to collagen hydrolysis and homolysis
Applying KIMMDY to collagen hydrolysis and homolysis
Arrhenius equation
\[ k = A\,\mathrm{e}^{\left(\frac{-\mathbf{E_\mathrm{a}}}{RT}\right)} \]
\(A\): pre-exponential factor (attempt frequency)
\(R\): gas constant
\(T\): temperature
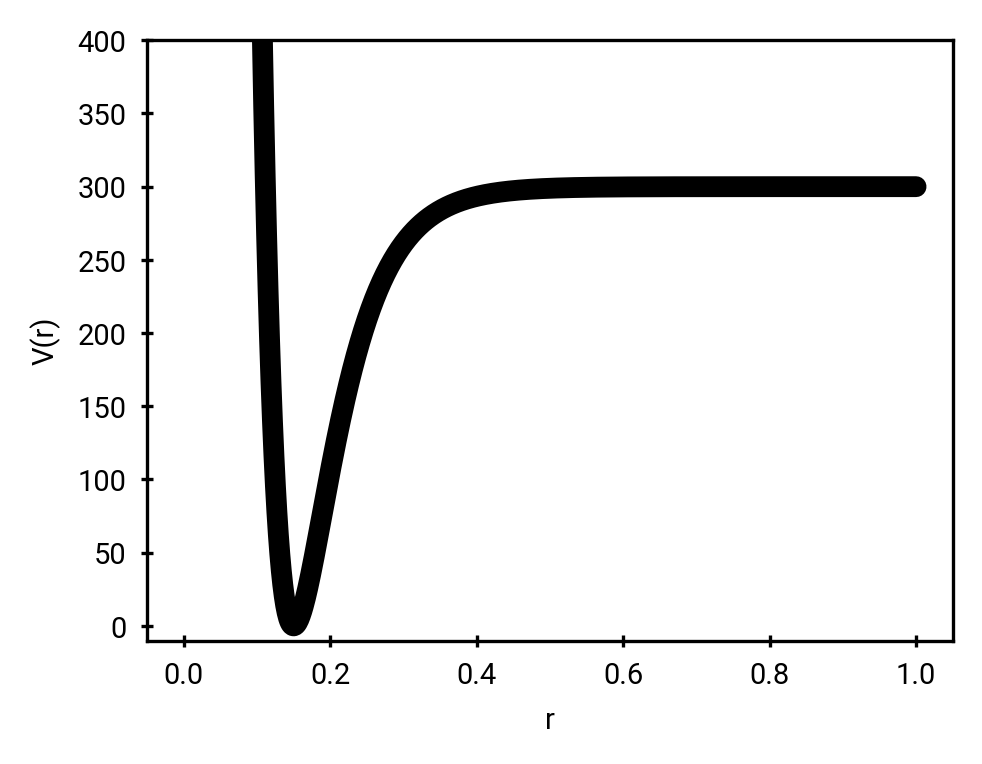
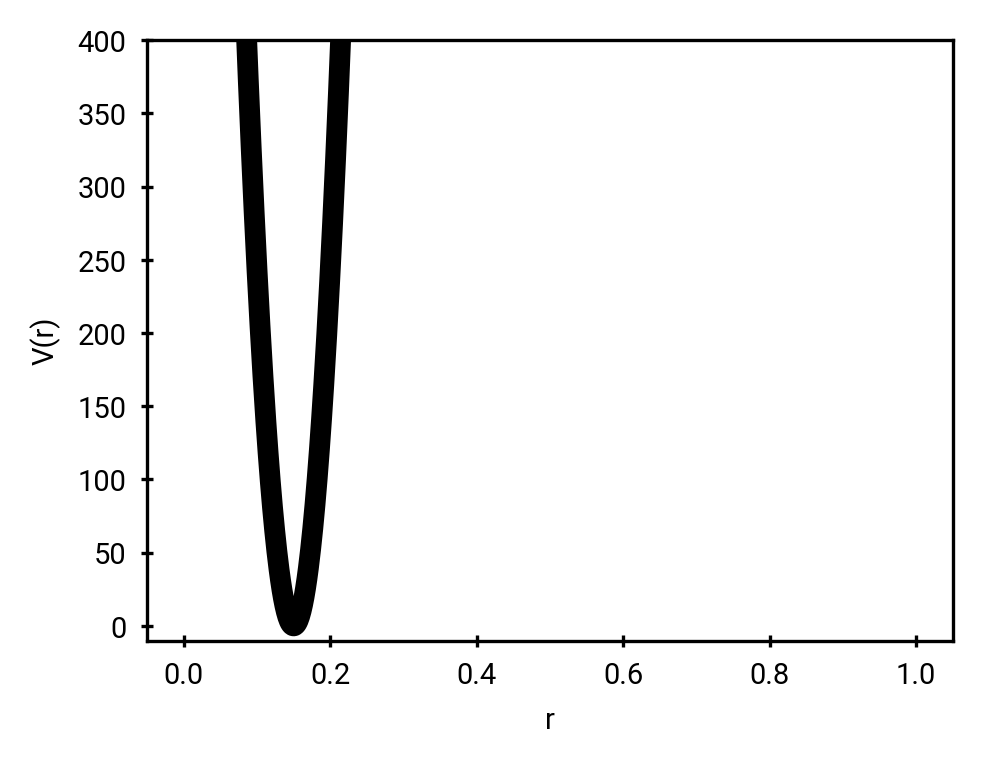
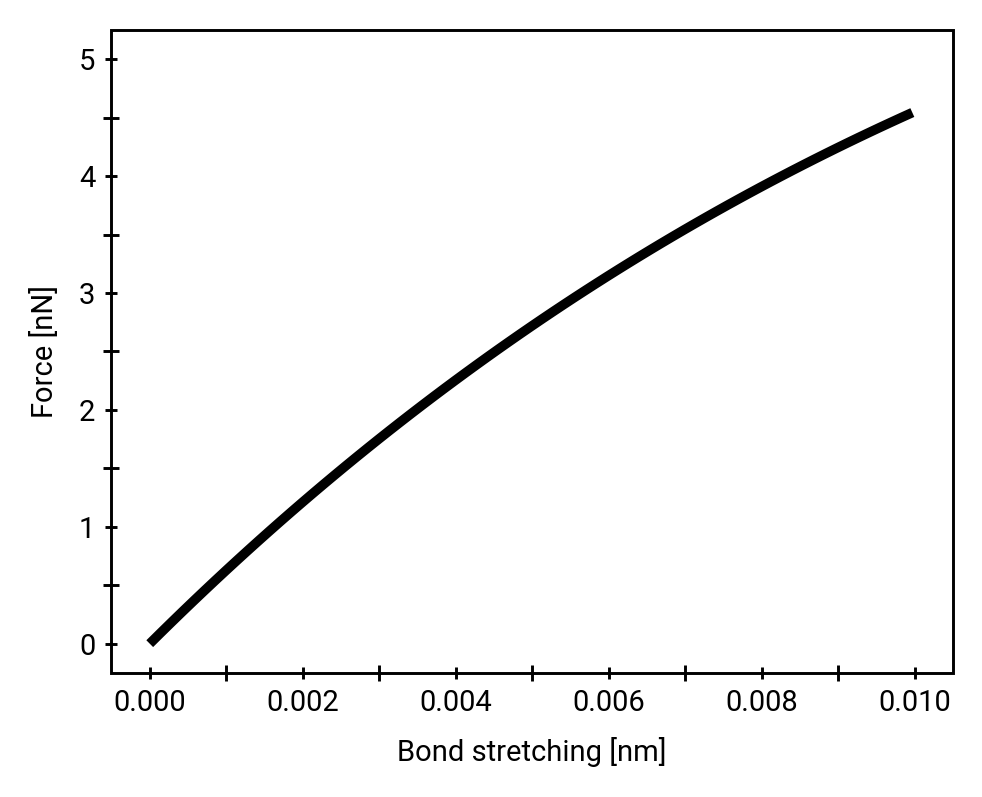
Morse potential
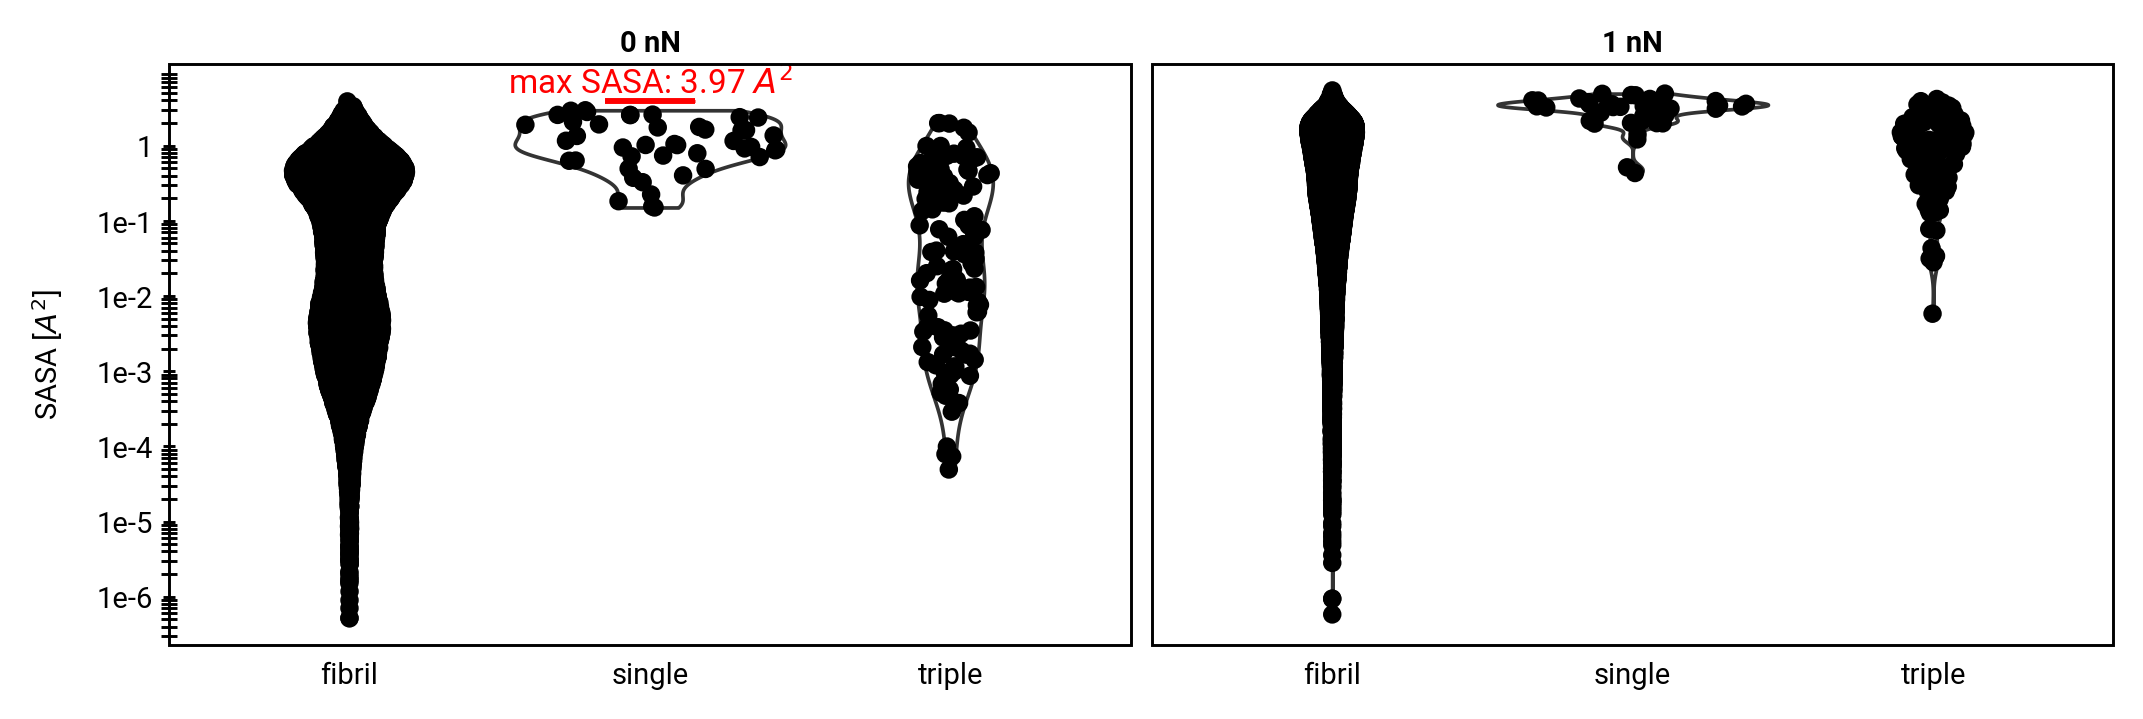
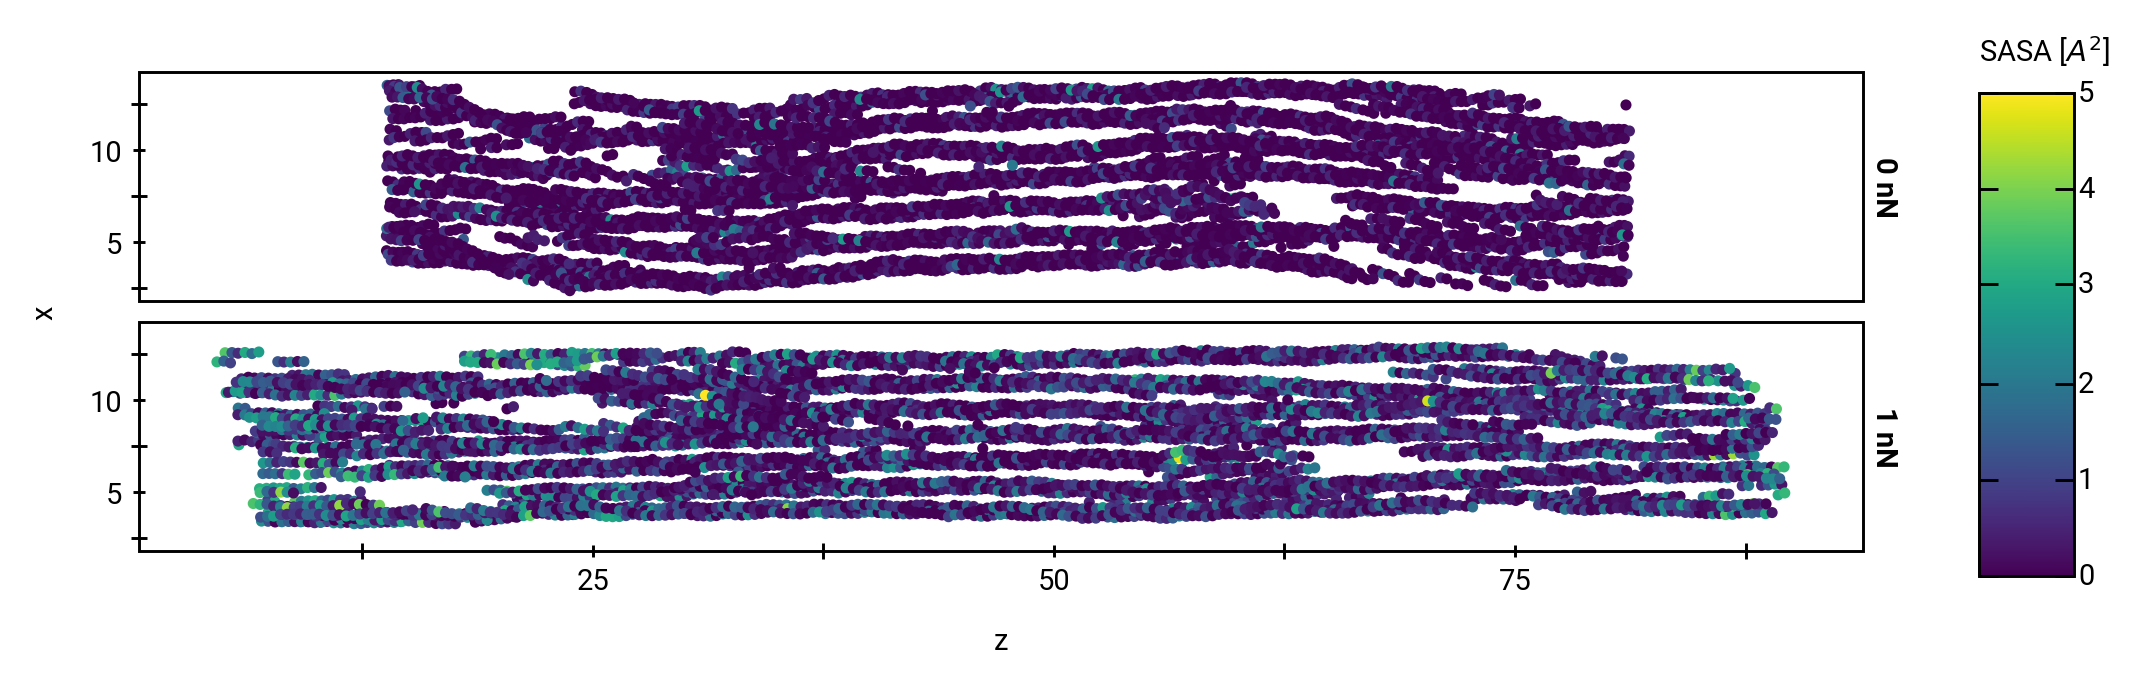
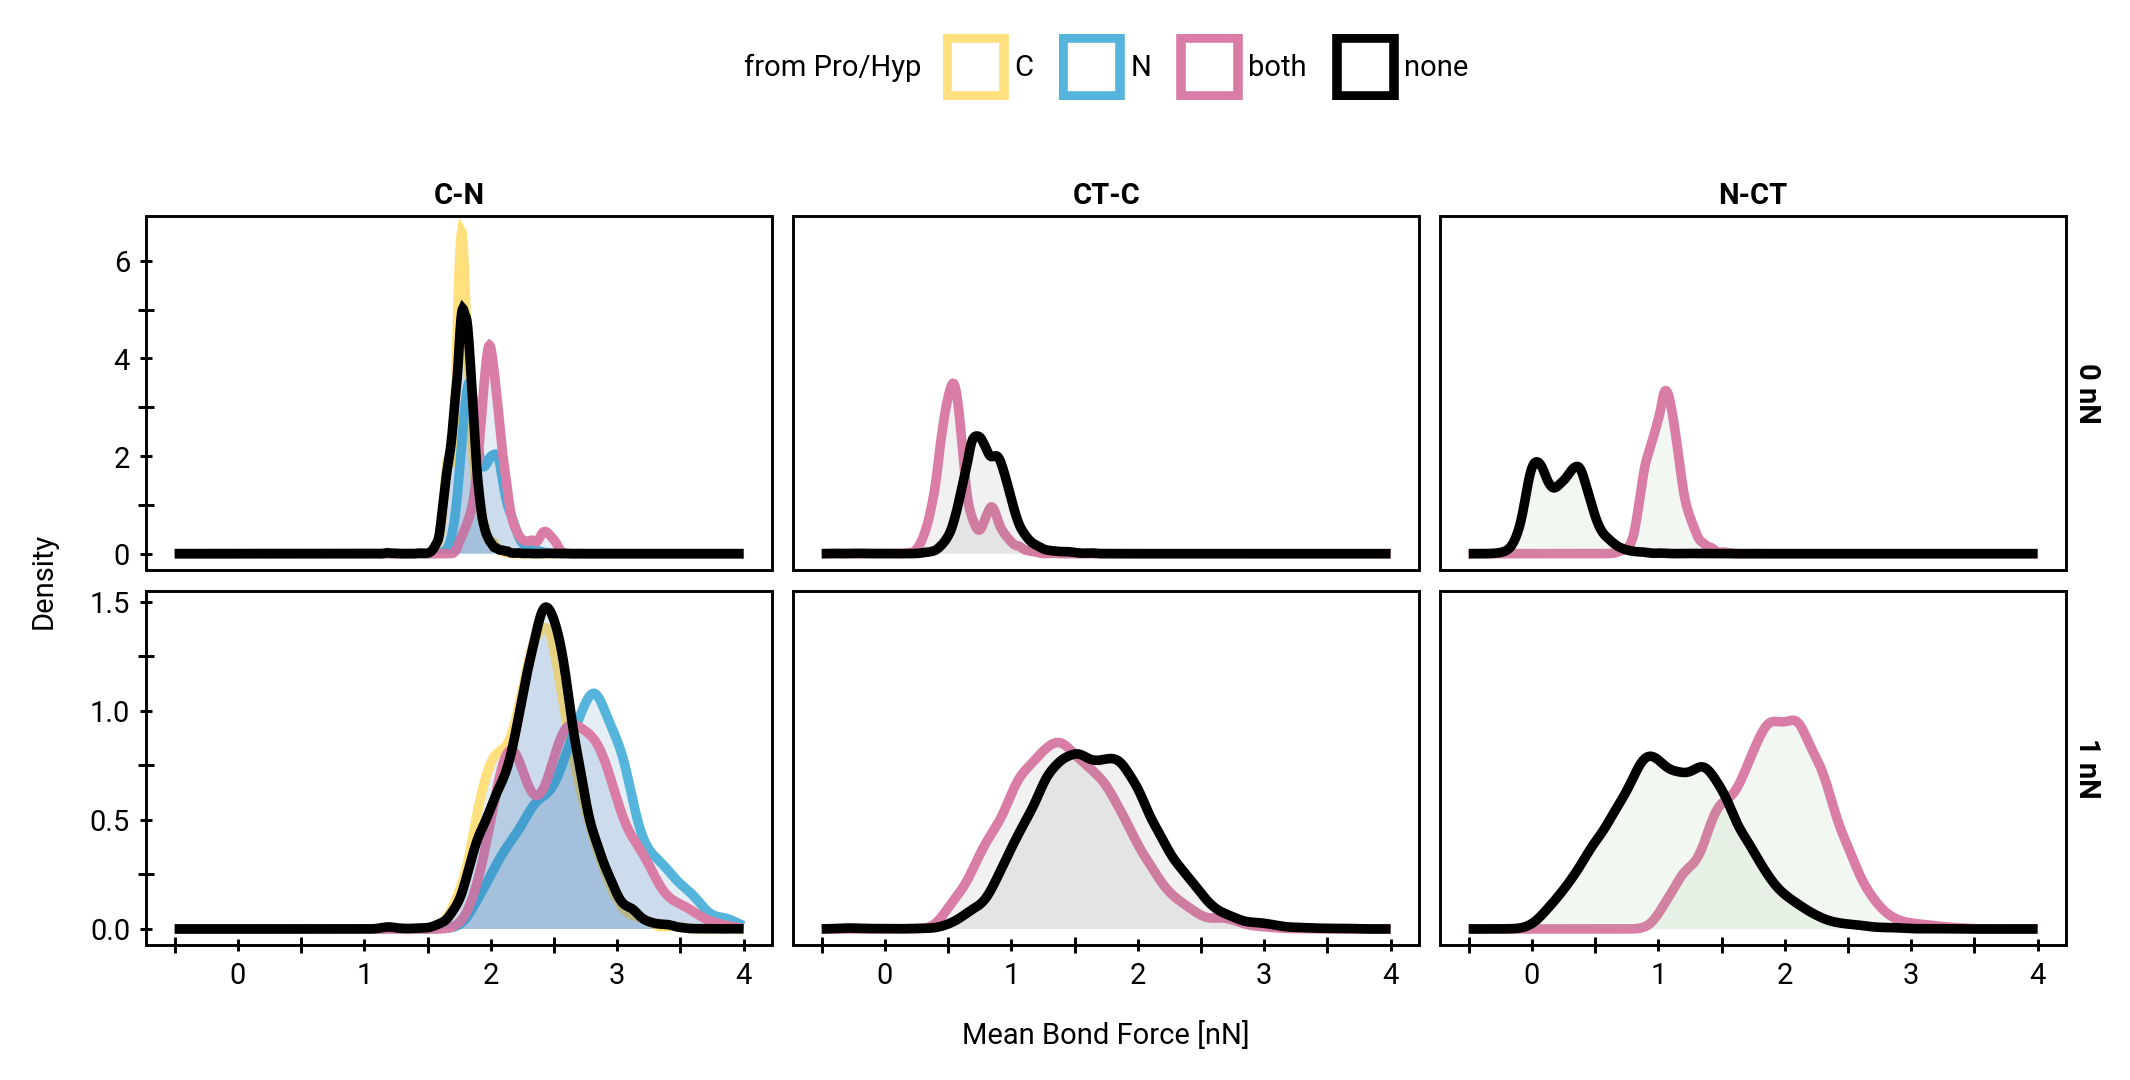
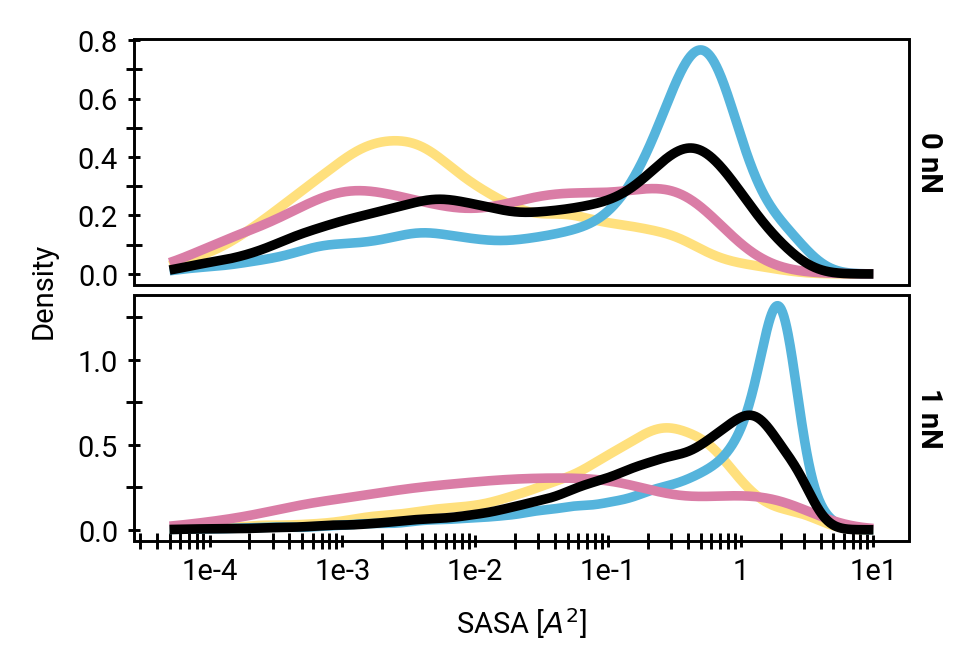
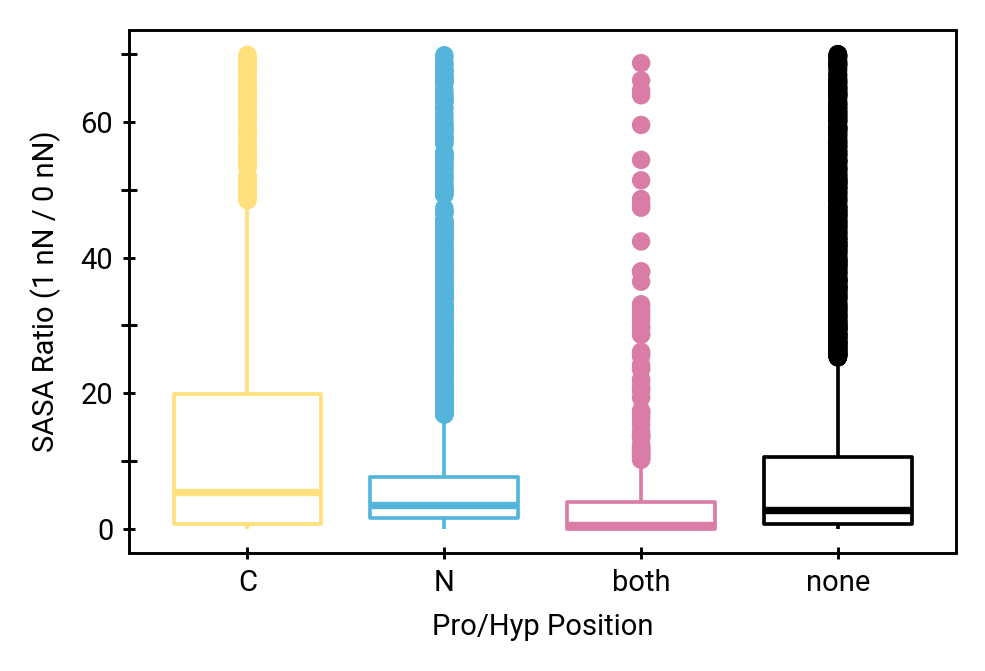
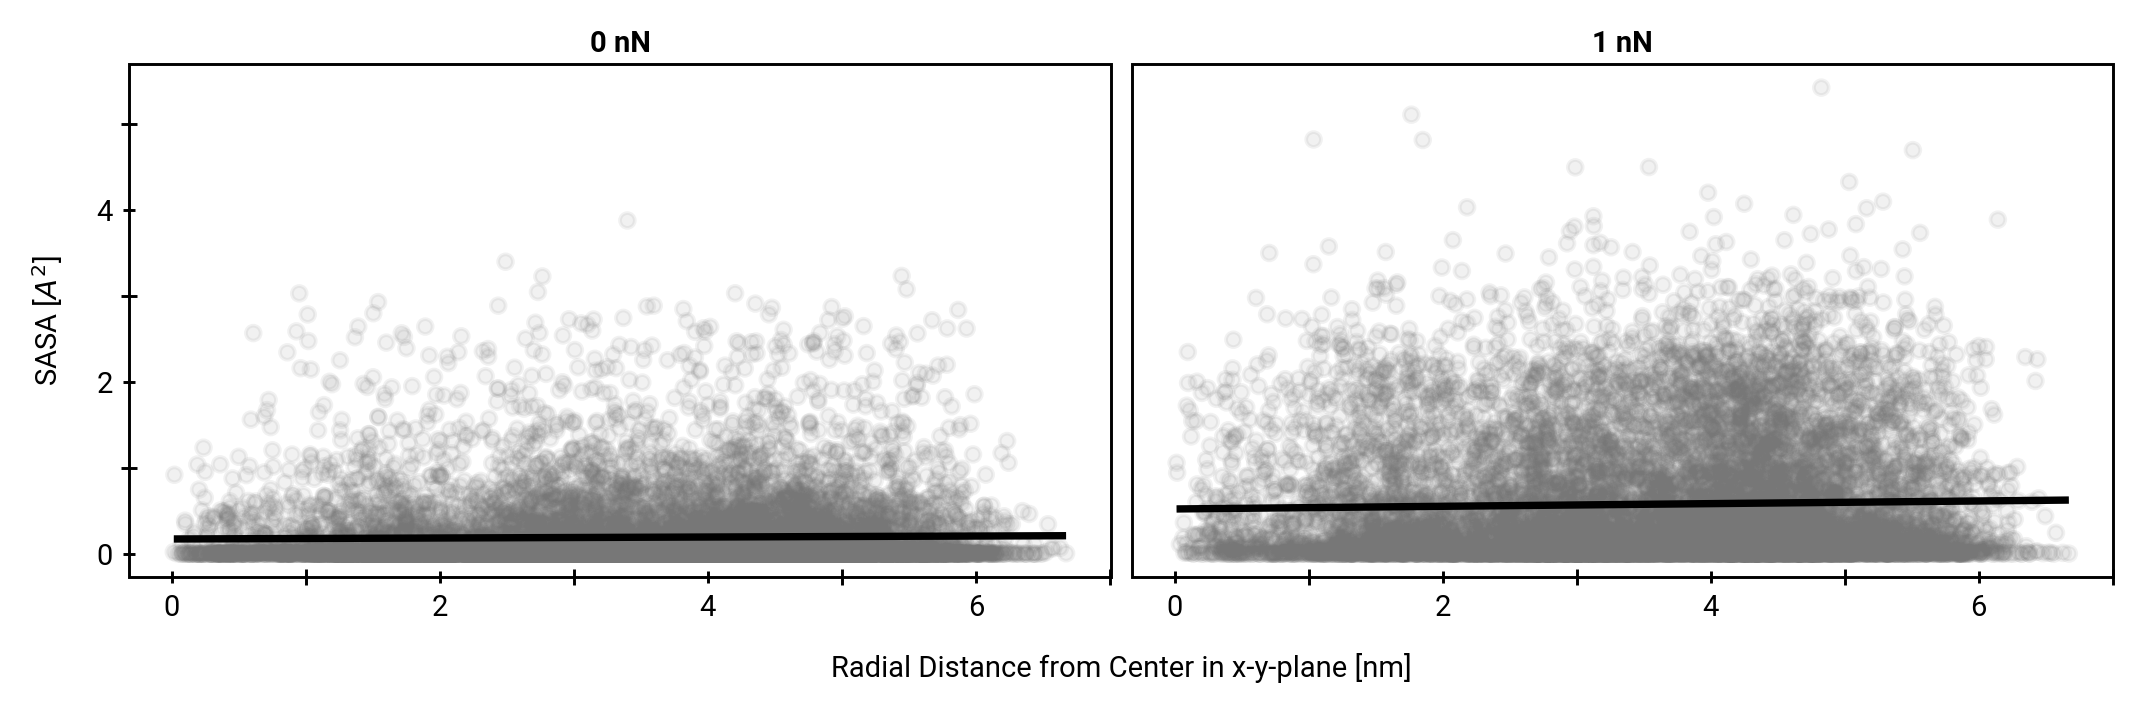
Hydrolysis rate incorporates SASA
SASA
Hydrolysis rate incorporates SASA
SASA = Solvent Accessible Surface Area
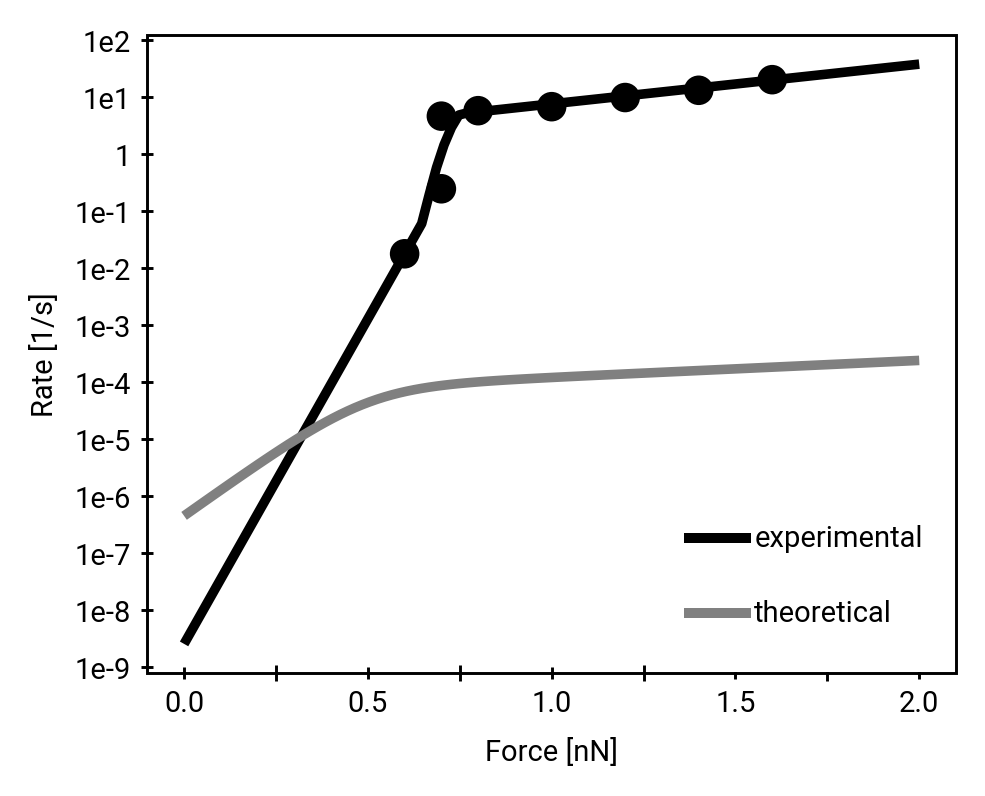
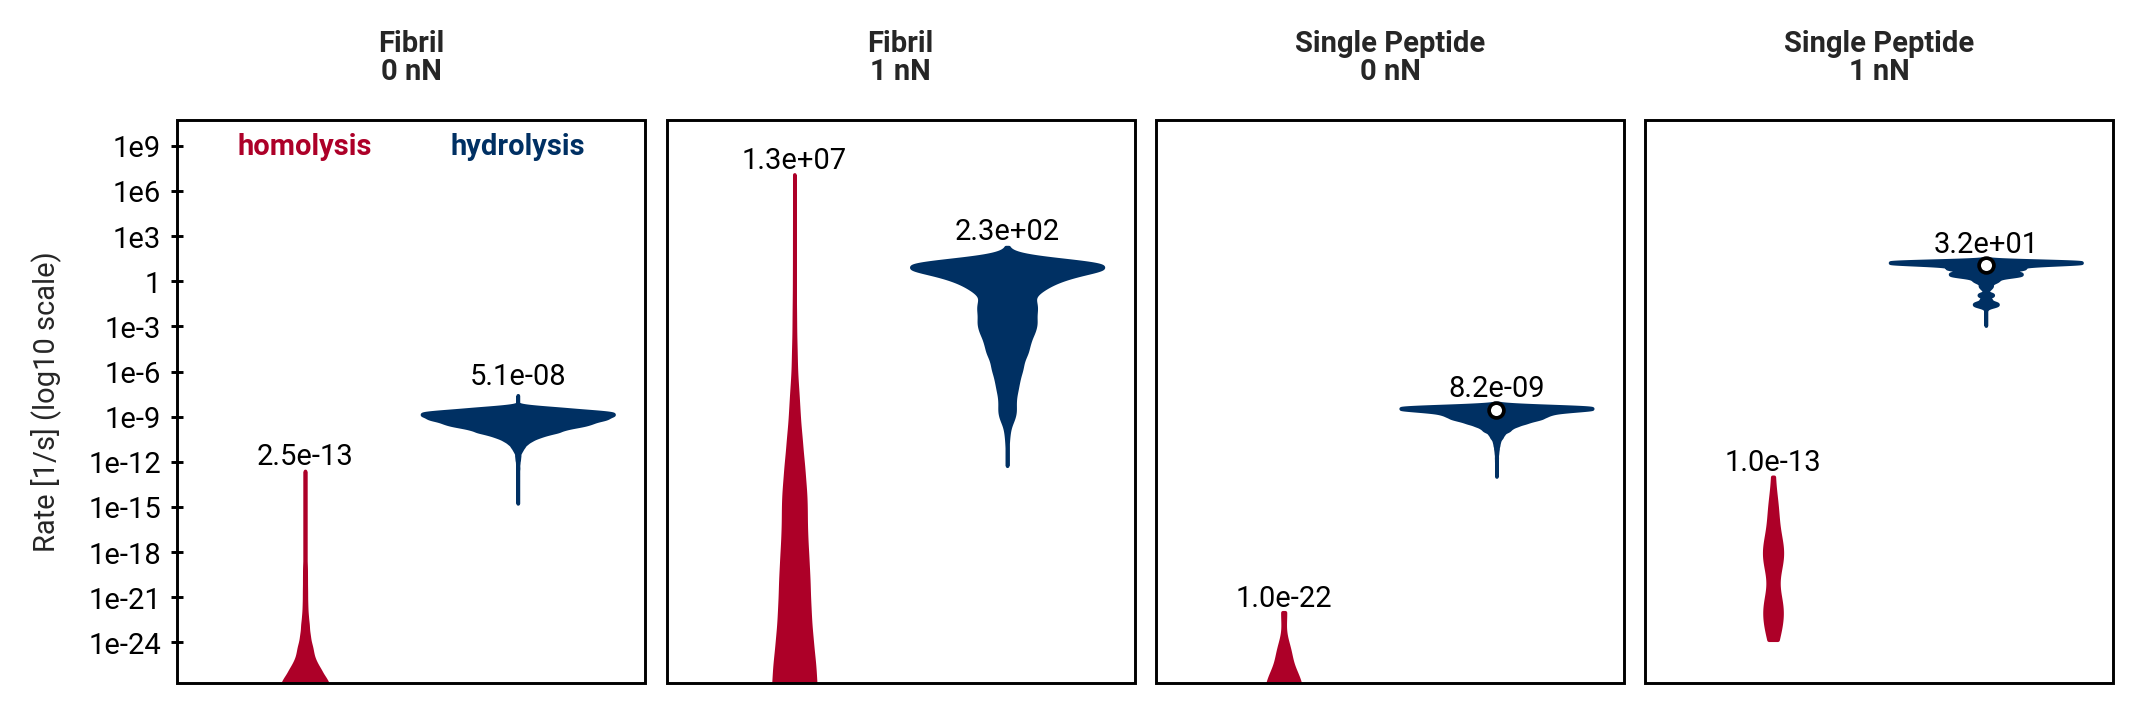
Hydrolysis rate incorporates pH, SASA and force
\[ \mathrm{Rate}(bond, t) = \ \frac{\mathrm{SASA}(bond, t)}{\mathrm{SASA}_{max}} \cdot \ \frac{c_{OH^-}}{c_{OH^-_{\mathrm{exp}}}} \ \cdot \mathrm{rate}_{\mathrm{exp}}(F_{bond,t}) \tag{2}\]
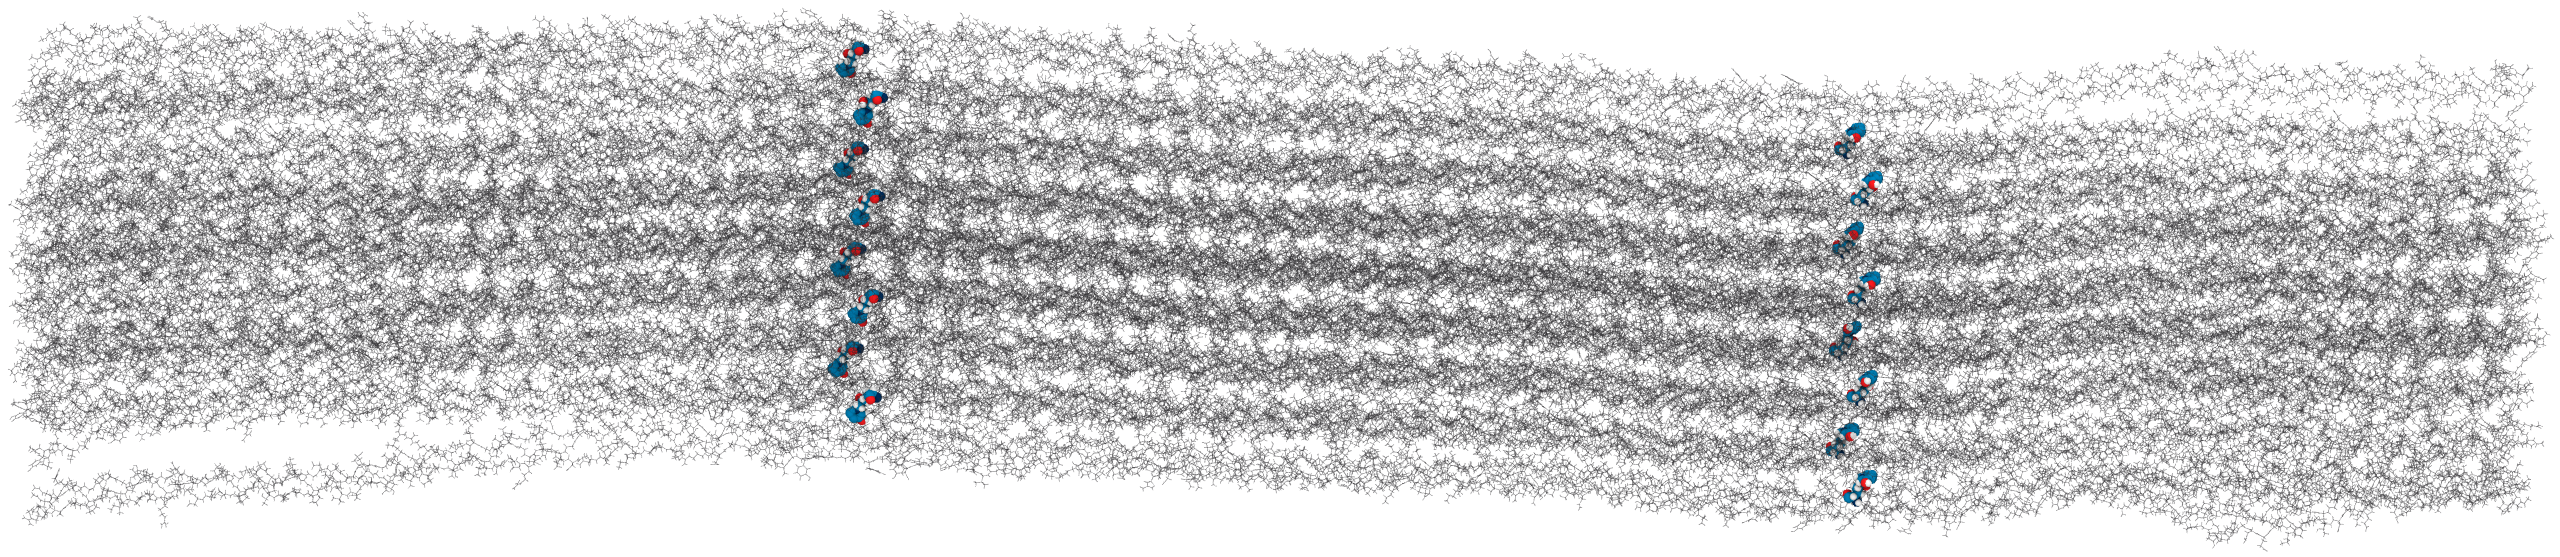
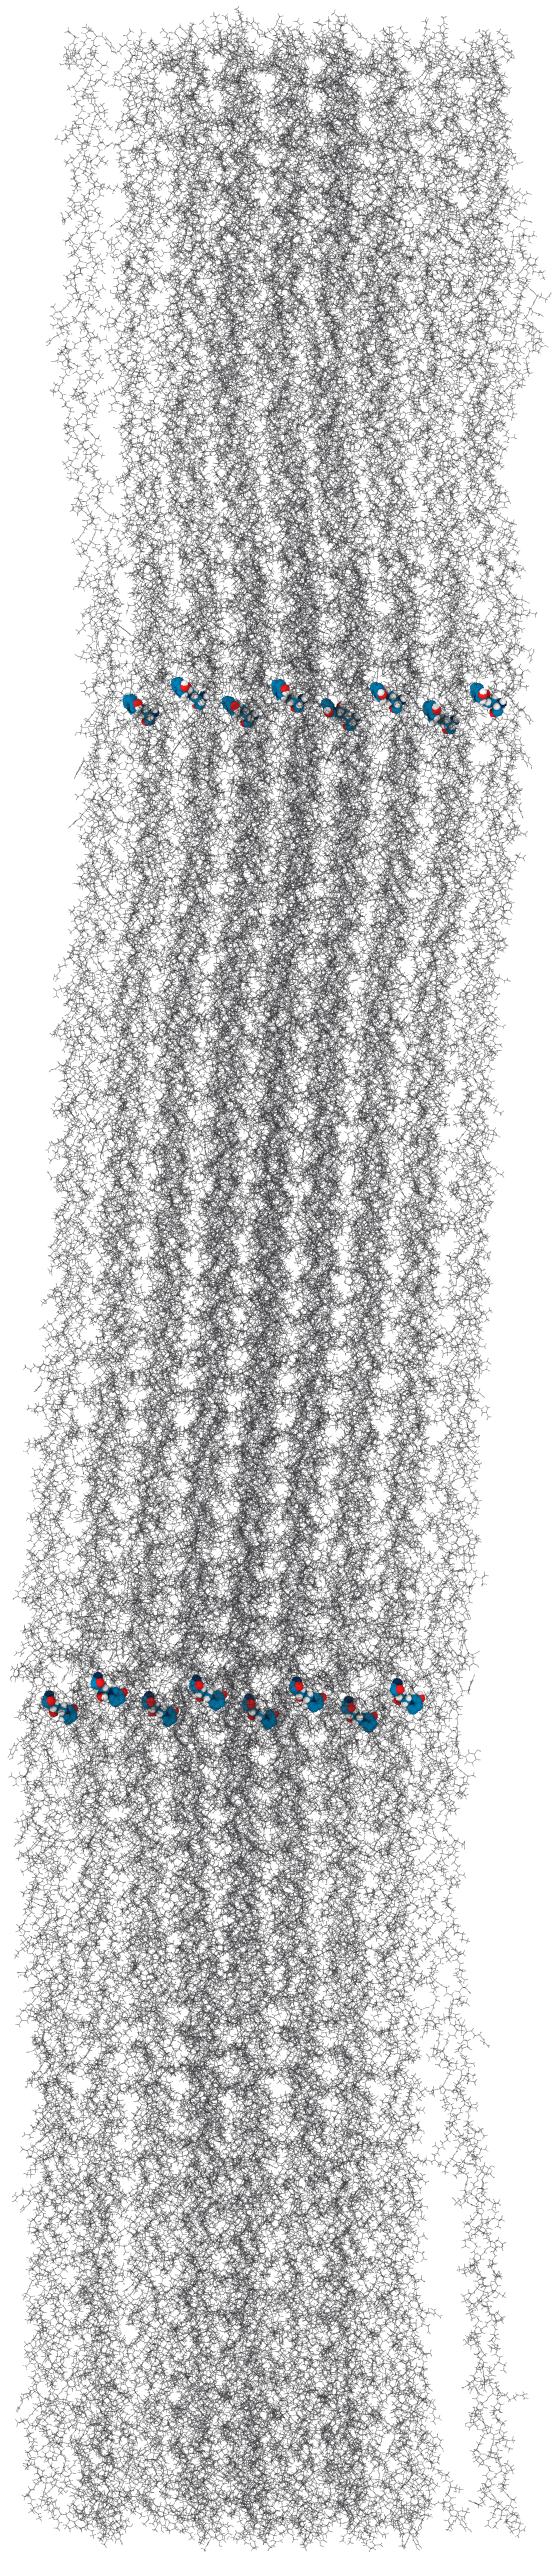
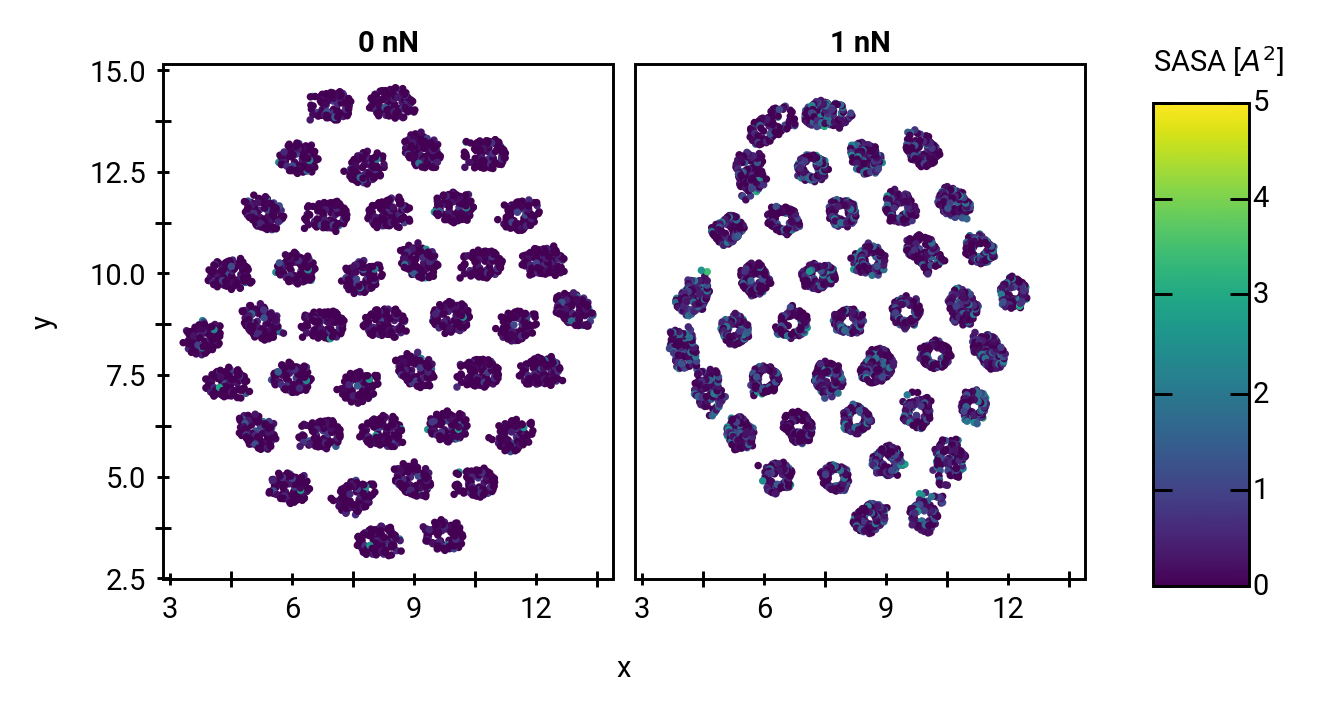
Solvent accessibility in the fibril is heterogeneous
peptide bonds near the center are still accessible
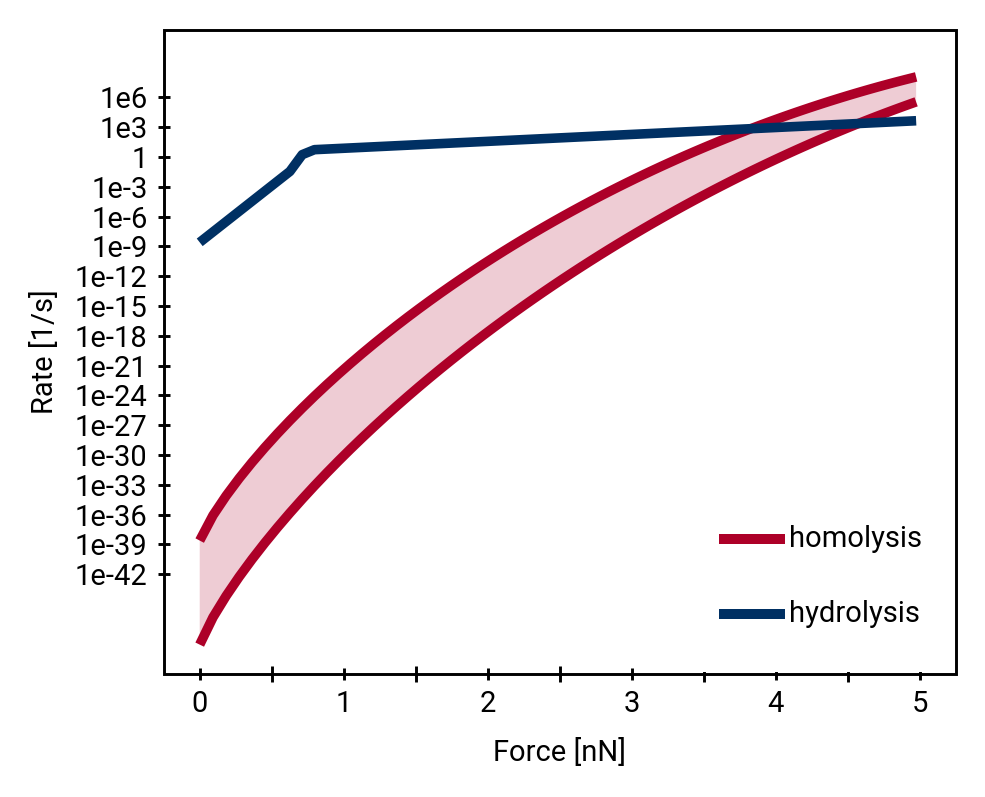
Homolysis becomes competitive with hydrolysis by force concentration
Discussion of KIMMDY results
- pH just a factor, could be e.g. constant pH simulations [12]
- SASA influence likely to be underestimated
- Need a link to real tissue experiments
Concluding Thoughts
KIMMDY is a versatile tool for reactive MD simulations:
graeter-group.github.io/kimmdy/
Collagen triple helix impedes hydrolysis
Homolysis becomes competitive to hydrolysis due to force concentration in cross-linked collagen fibrils
Thank You!
Questions?
This work was supported by the Klaus Tschira Foundation and has received funding from the European Research Council (ERC).
Force Fields and Topologies
QM/MM simulations reveal mechanistic details of the tetrahedral intermediate formation
More SASA
KIMMDY finds a new radical scavanging candidate in collagen


Proton mobility in explicit QM solvent molecules allows breaking of the peptide bond
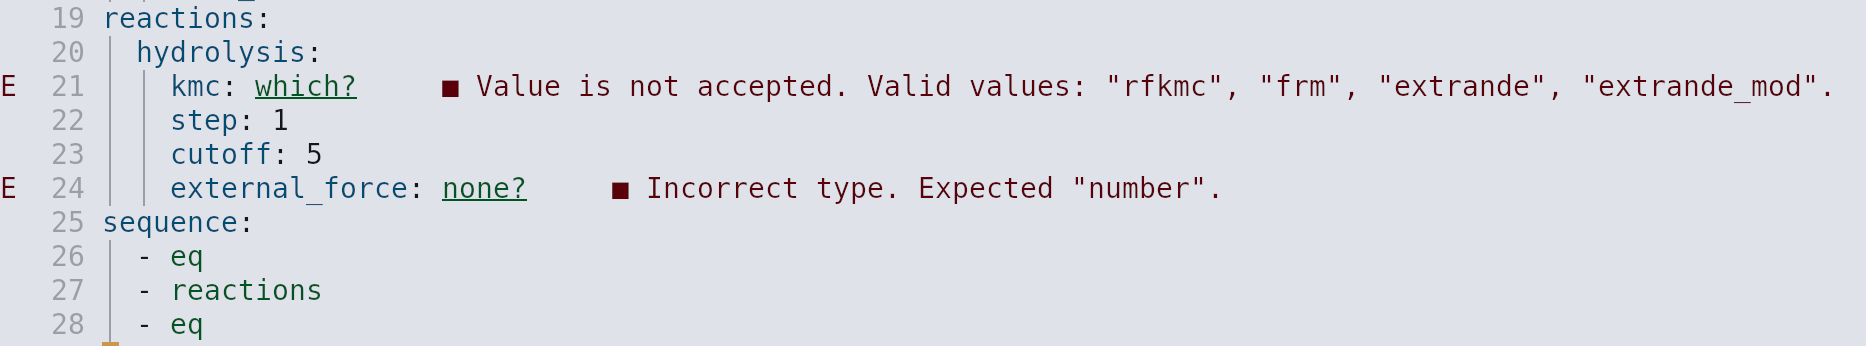
KIMMDY is easy to install and well documented
graeter-group.github.io/kimmdy/

KIMMDY is easy to use
Direct comparison of hydrolysis and homolysis force response
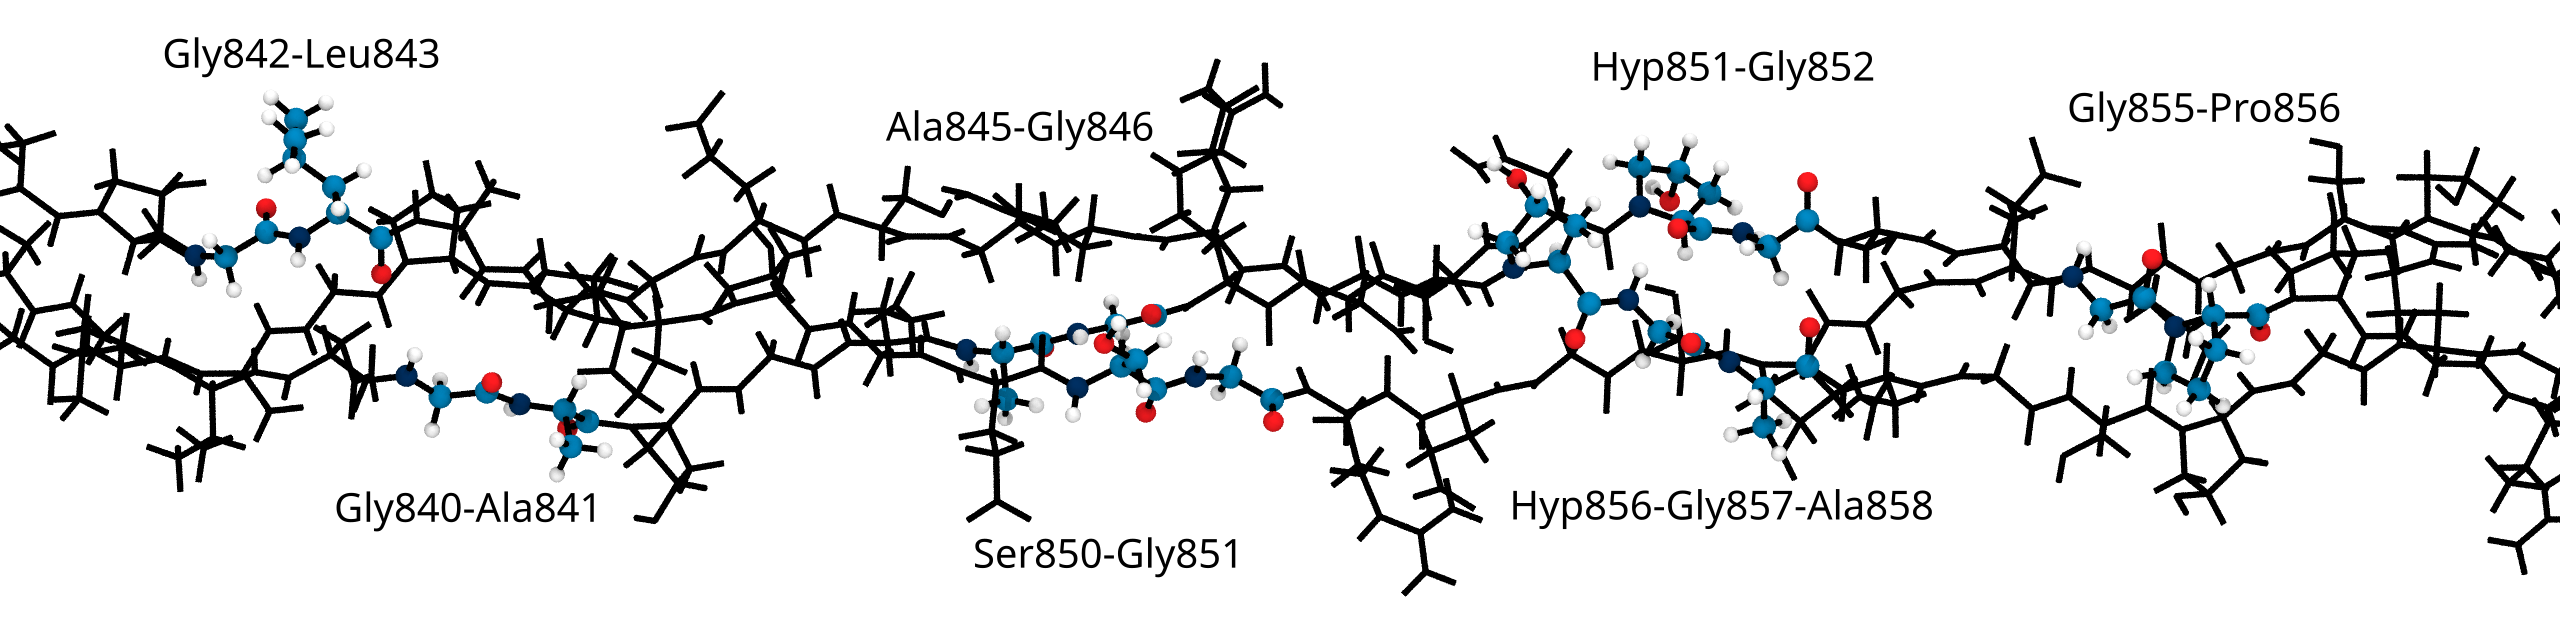
The unique effect of prolines

Peptide bonds near the center are still accessible
Supplementary Information
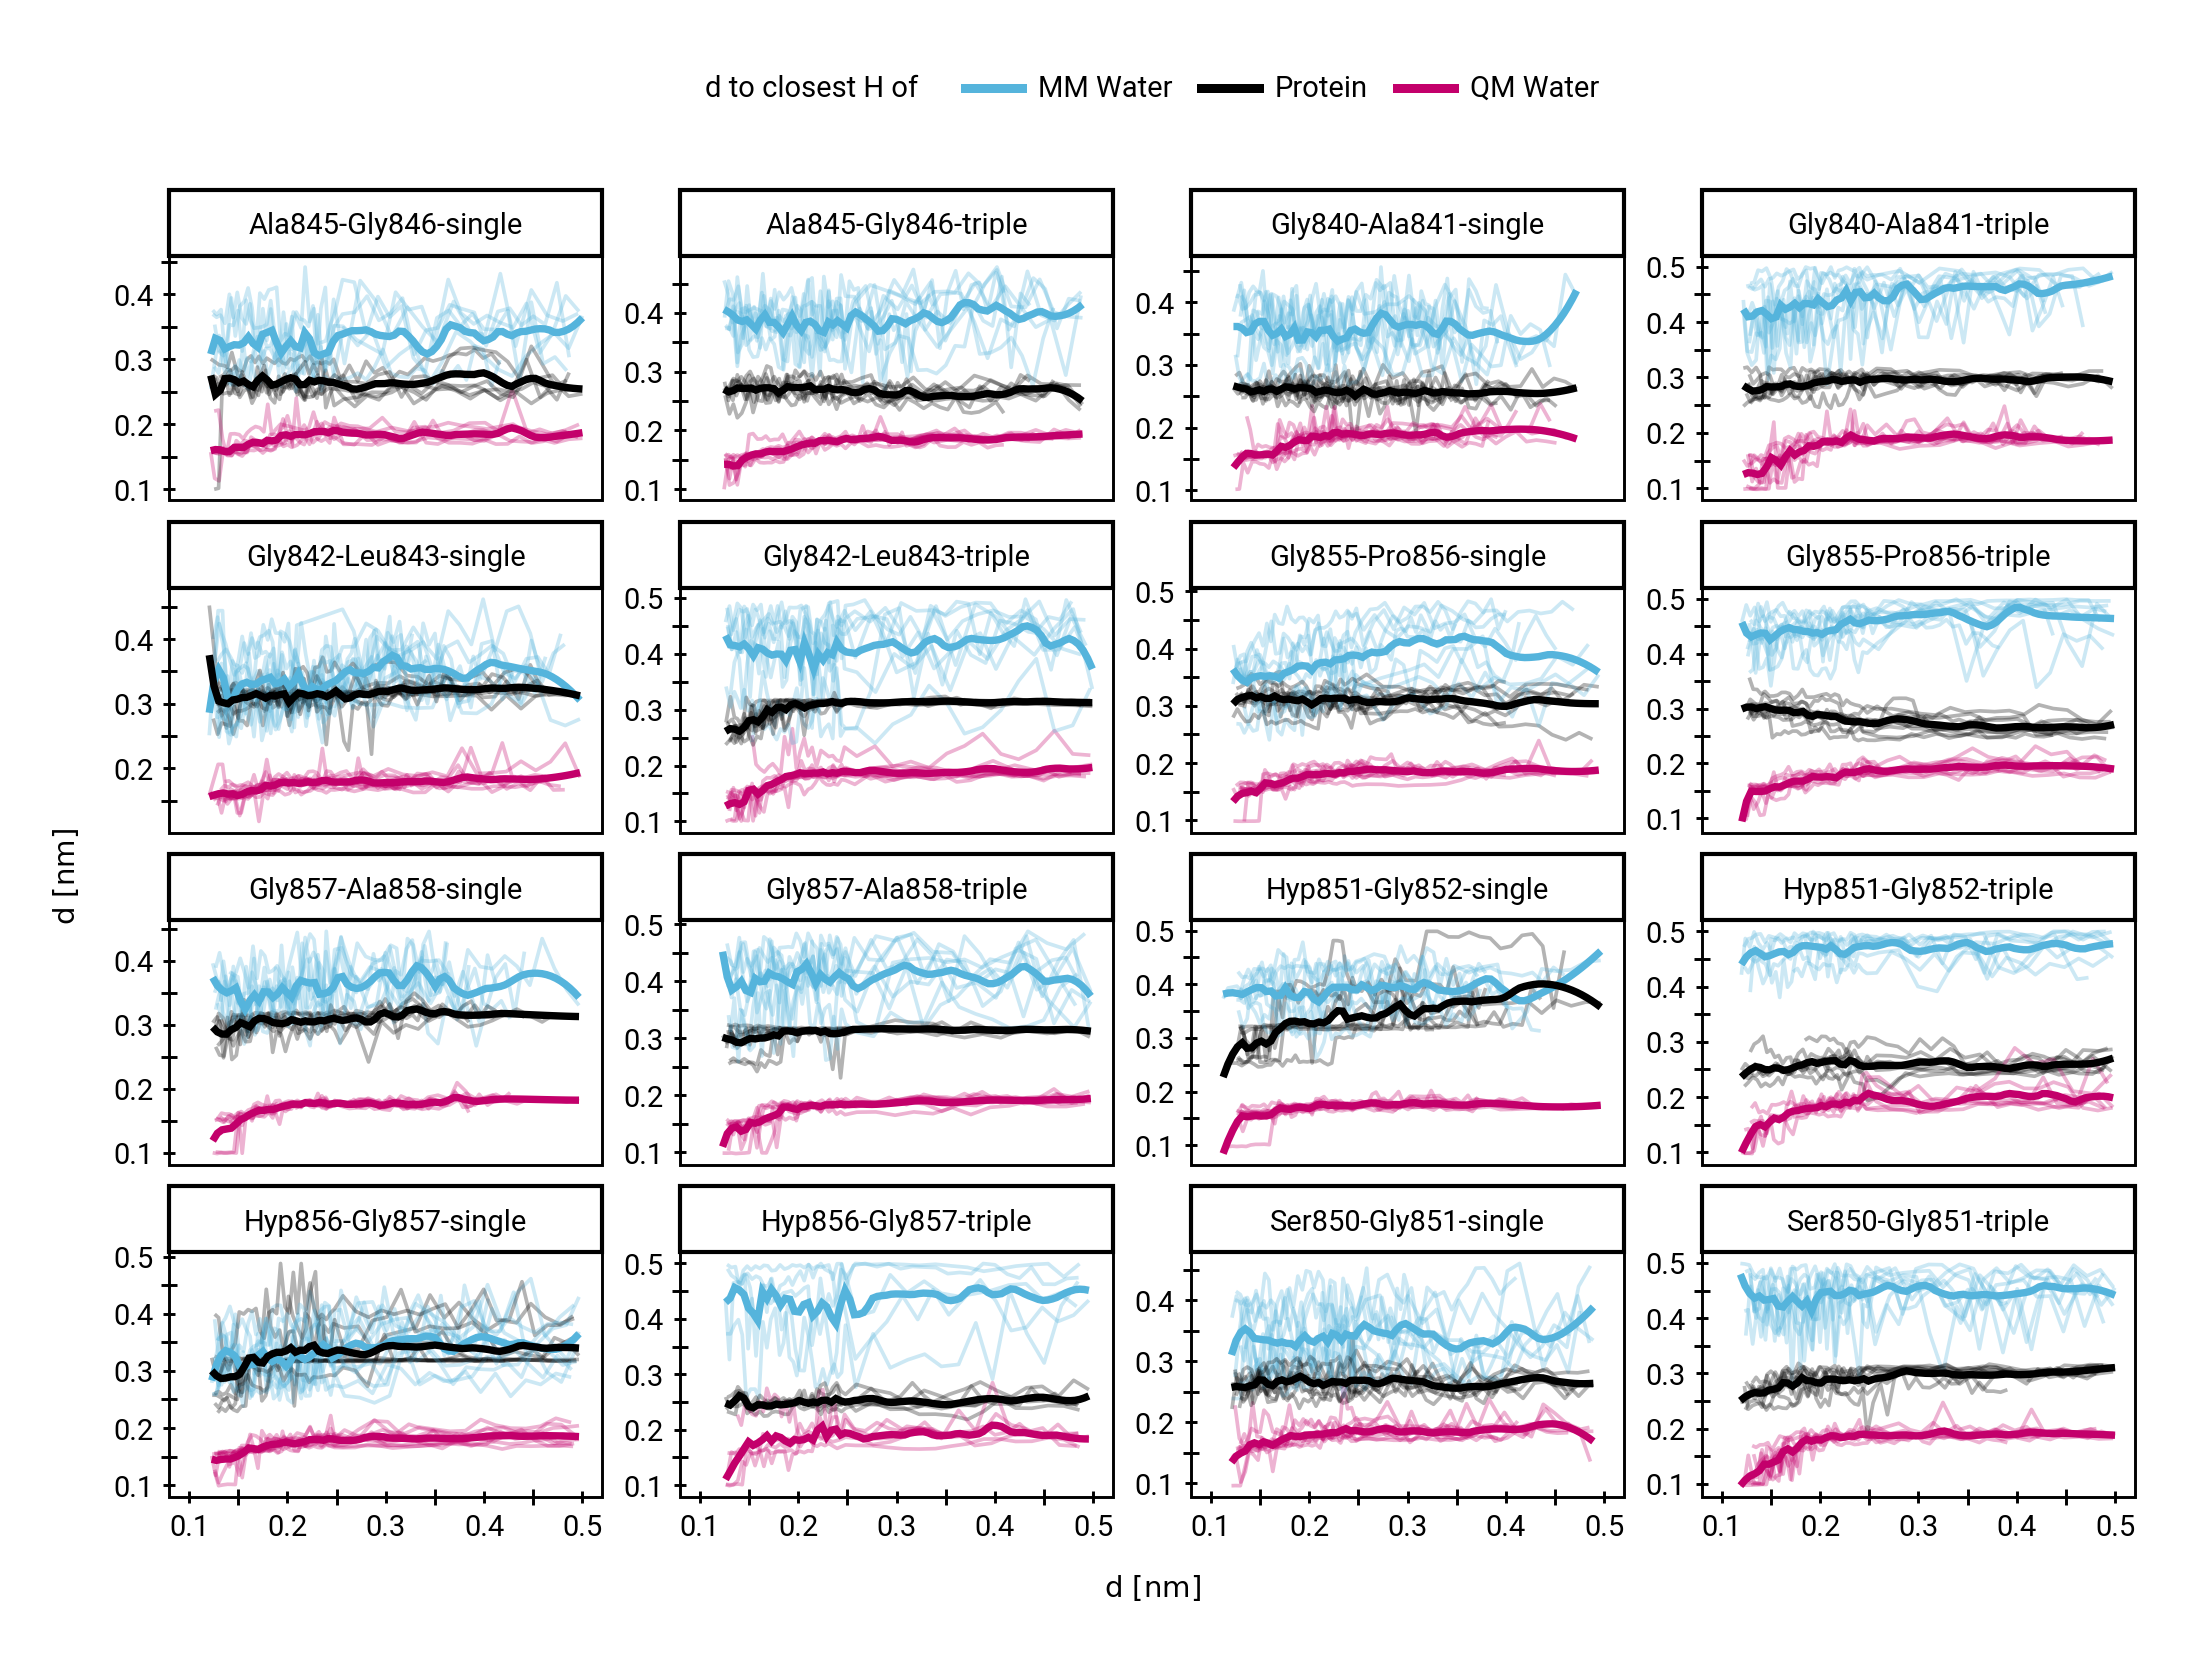
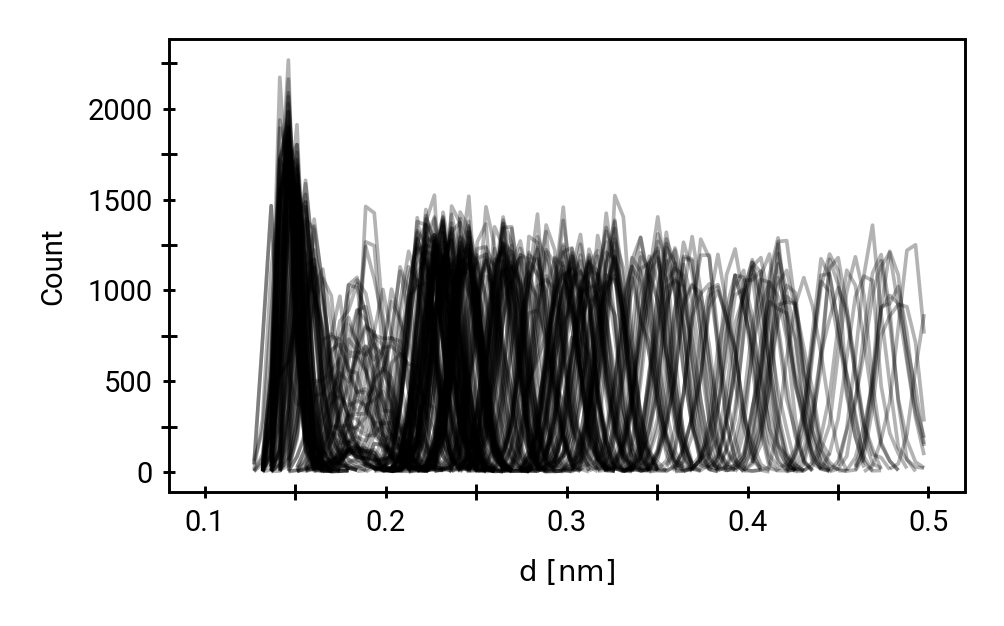
Small multiples plot of the approach of the hydroxide in terms of distances of the carbonyl \(\ce{O}\) of the TI to nearest proton of either a MM solvent molecule (cyan), the protein (black) or the QM water (magenta) across all umbrella windows. Distances are average within each window and the windows belonging to the same approach simulation are connected. The thick lines are a LOESS curve across all windows.
Supplementary Information
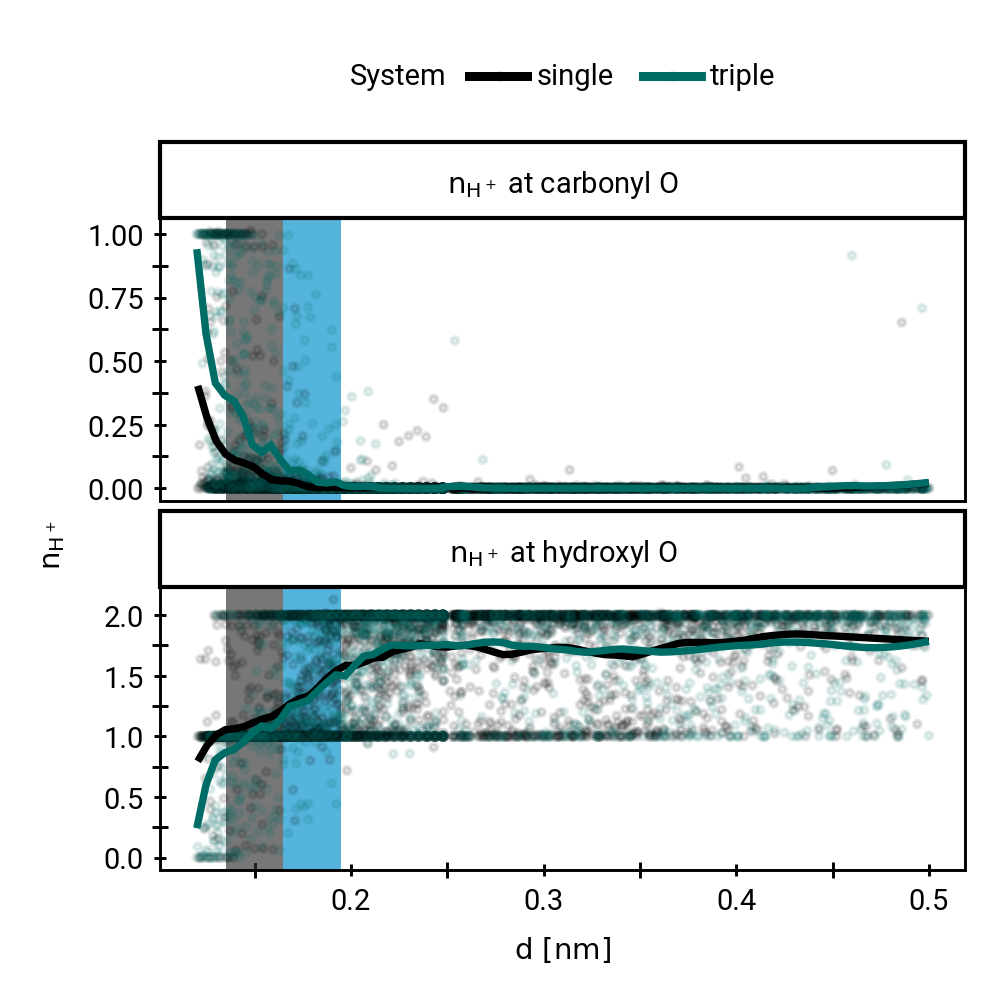
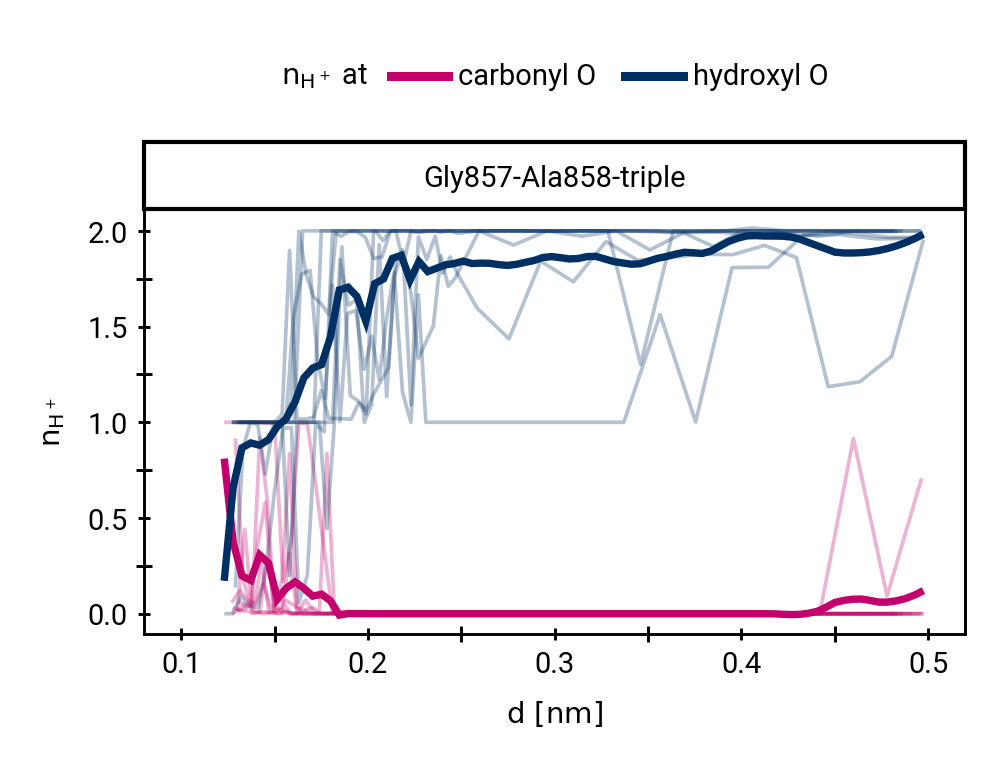
Figure 1: The protonation states are show as the average number of protons assigned to either the hydroxyl \(\ce{O}\) or the carbonyl \(\ce{O}\) with all sampling windows averaged for each system. The region for detection of TS1 is shaded cyan, while the region for detection of the TI is shaded gray.