plt <- ggplot2::ggplot(ggplot2::mpg, ggplot2::aes(displ, cty)) +
  ggplot2::geom_point()
plt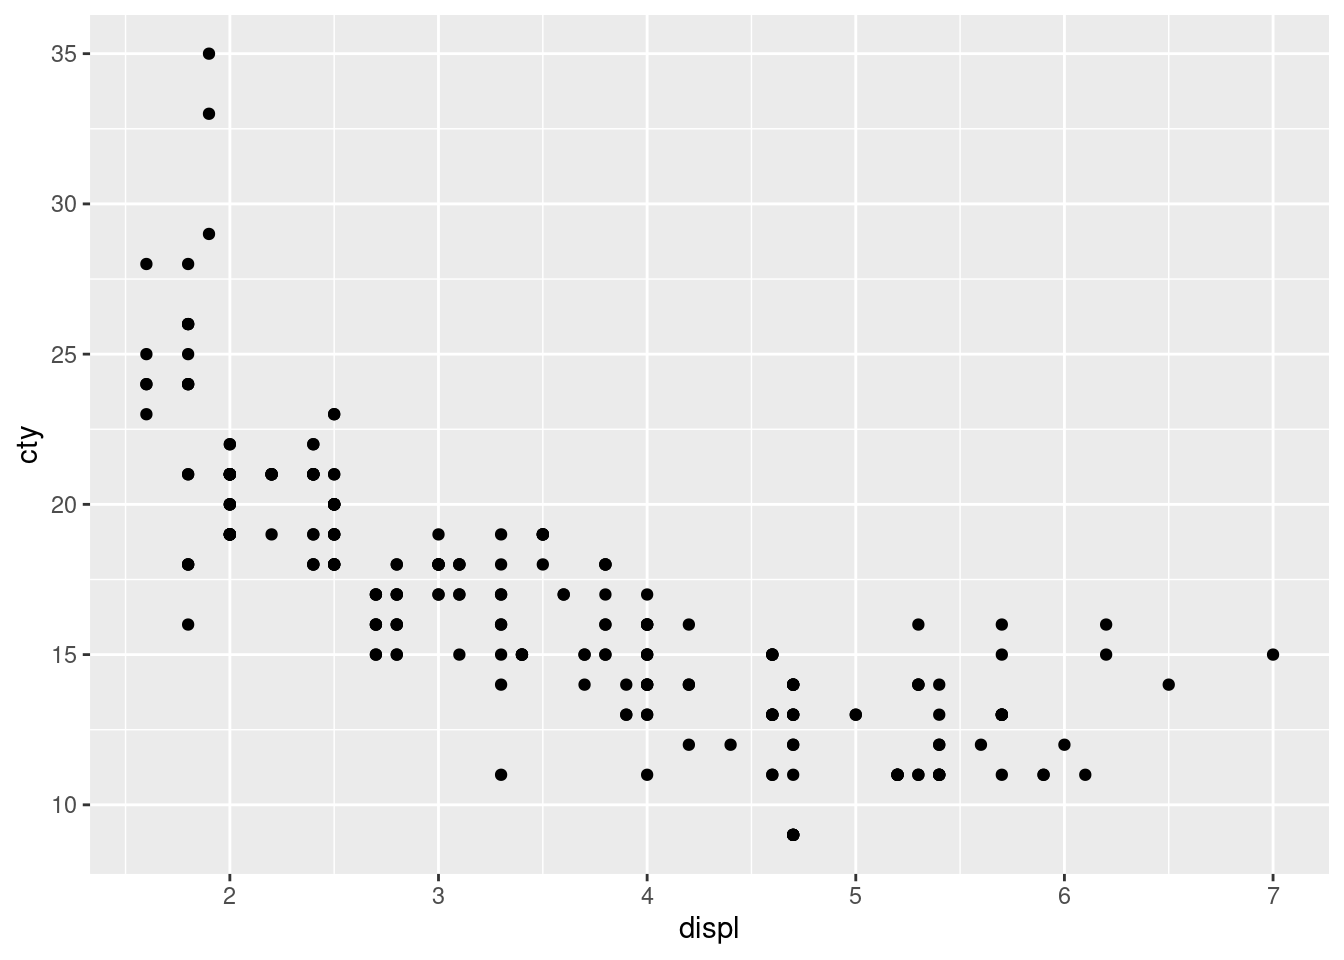
Testing quarto / Rmarkdown features.
R Core Team (2020)
Example from the mathjax demo:
When \(a \ne 0\), there are two solutions to \(ax^2 + bx + c = 0\) and they are
\[x = {-b \pm \sqrt{b^2-4ac} \over 2a}.\]
If I have a random $ and another $ in my text.
plt <- ggplot2::ggplot(ggplot2::mpg, ggplot2::aes(displ, cty)) +
ggplot2::geom_point()
plt
print("hello world")[1] "hello world"w and s move the left paddle, o and l move the right paddle.
DT::datatable(head(iris))print("test")[1] "test"plt <- ggplot2::ggplot(ggplot2::mpg, ggplot2::aes(displ, cty)) +
ggplot2::geom_point()
plotly::ggplotly(plt)However, while this options brings back plotly, it also disables math rendering for this document on the site.
\[sd = \sqrt{\frac{\sum_{i=0}^{n}{(x_i-\bar x)^2}}{(n-1)} }\]
graph TB
A-->B
A-->C
C-->E
B-->D
C-->D
D-->F
E-->F